developer portal
build on the stream.
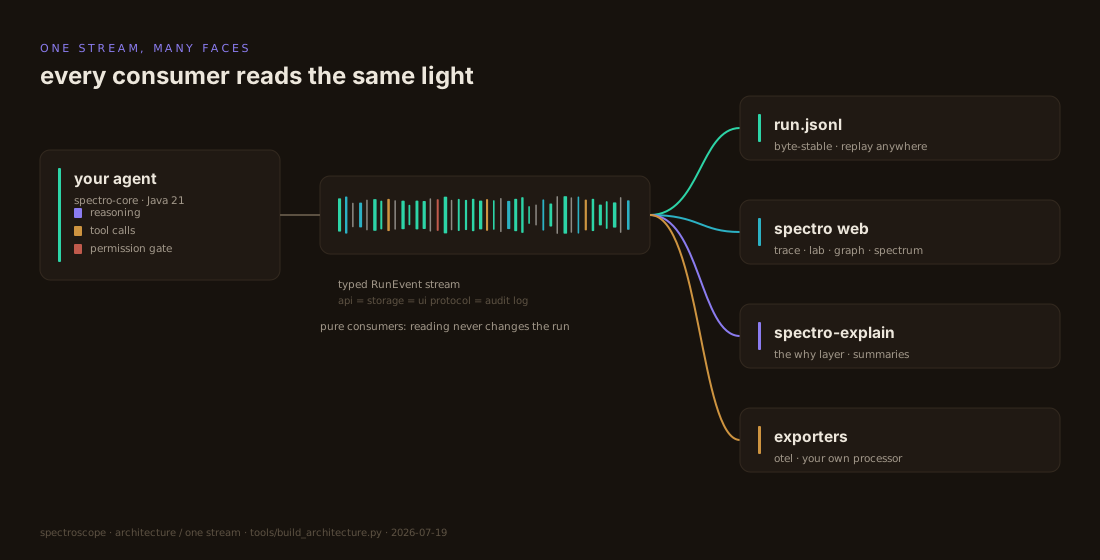
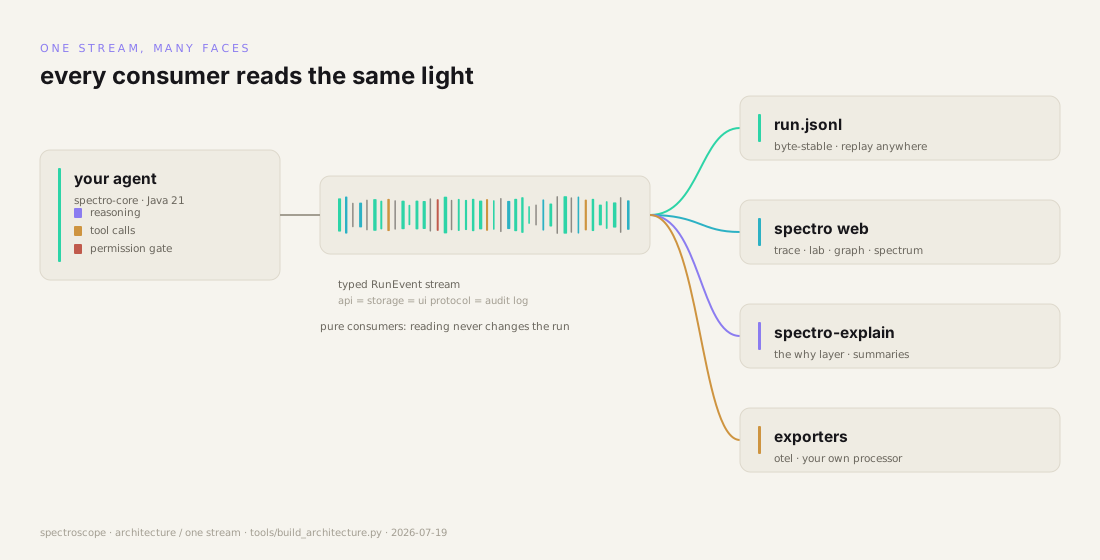
Everything in spectroscope hangs off one idea: an agent run is a typed stream of RunEvents, and that stream is at once the API, the storage format, the UI protocol, and the audit log. This page gets you from zero to reading the stream.
the complete user guide
Every surface in one book, from the thirty-second start to the fleet reference. Every screenshot is a real capture of the running app, reshot per release in both editions.
quickstart
an agent in five lines
The facade below is frozen: it already runs in the codebase exactly as written, and it is pinned by tests so it stays this way. v0.15.5 is on Maven Central under the coordinates shown. The source is public at github.com/spectroscope/spectroscope.
var agent = Spectro.agent()
    .model(Anthropic.opus())
    .tools(Tools.readFile(), Tools.runCommand())
    .workspace(Path.of("/tmp/scratch"));

for (RunEvent event : agent.run("Write hello.py and run it")) {
    System.out.println(event);   // the stream IS the observability
}
from spectroscope import Spectro, Anthropic, Tools
agent = Spectro.agent(
model=Anthropic.opus(),
tools=[Tools.read_file, Tools.run_command,
Tools.spawn_agents],
workspace="/tmp/scratch",
)
for event in agent.run("Write hello.py and run it"):
print(event) # the stream IS the observabilitythe Python port is in design: the JSONL wire is the contract, so the stream reads the same in both
maven
<dependency>
  <groupId>dev.spectroscope</groupId>
  <artifactId>spectro-core</artifactId>
  <version>0.15.5</version>
</dependency>
the API docs live at javadoc.io/doc/dev.spectroscope/spectro-core
cli
$ spectro run "write hello.py and run it"
$ spectro replay run.jsonl  # byte for byte
$ spectro web               # the whole cockpit
$ spectro doctor            # checks your setup
plain Java 21 on virtual threads · no reactive DSL · no container · tools sit behind a permission gate, because tool inputs are model output and therefore untrusted
install
get spectroscope
Four ways onto your machine, and all four end in the same app. The
desktop build is signed and notarized and carries its own JRE and
its own llama-server, so the target machine needs no
Java and no Homebrew. The Maven coordinates above are for
embedding the libraries in your own code; this is for running the
app itself.
homebrew
One command, and brew upgrade keeps it current.
The cask installs the notarized release build. Apple silicon
only.
$ brew install --cask \
  spectroscope/tap/spectroscope
the cask lives at github.com/spectroscope/homebrew-tap
release dmg
Download the disk image from the latest release and drag the app in. It is signed and notarized, so it opens on double-click without a warning to click through.
github.com/spectroscope/spectroscope/releases/latest
→ spectroscope-0.15.5-arm64.dmg
the release page also carries the CLI zip and the plain server jar
linux · apt
Debian 12 and Ubuntu 24.04, x86_64. Pin the key, add the
source, install. apt upgrade keeps it current from
then on, and ~/.spectro survives a removal.
curl -fsSL https://apt.spectroscope.dev/spectroscope.asc \
  | sudo gpg --dearmor -o /usr/share/keyrings/spectroscope.gpg
echo "deb [signed-by=/usr/share/keyrings/spectroscope.gpg] https://apt.spectroscope.dev stable main" \
  | sudo tee /etc/apt/sources.list.d/spectroscope.list
sudo apt update
sudo apt install spectroscope
For other distributions the release page carries
spectroscope-0.15.5-x86_64.AppImage. There is no
arm64 Linux build: apt accepts the source on an arm64 machine
and then finds no package. The repository, the key fingerprint
and the tamper tests are at
apt.spectroscope.dev.
from source
Clone and go. The ./spectro launcher resolves a
JDK 21+ for you; the code is MIT.
$ git clone https://github.com/spectroscope/spectroscope.git
$ cd spectroscope
$ ./spectro web start   # web UI → http://127.0.0.1:8080, in the background
$ ./gradlew build       # everything + all tests
the packaged builds are macOS on Apple silicon and Linux on x86_64 · raw Gradle works too (JDK 21+ as JAVA_HOME) · web development wants Node 20+
the contract
one JSONL file is the whole truth
A finished run lands as newline-delimited JSON: ordered, complete, byte-stable. The wire format is the compatibility contract of the project, so a trace recorded on one machine replays on any other. These lines are abridged from the bundled review fan-out scenario:
{"type":"run_start","runId":"fanout-main","agentId":"main","prompt":"Review the open PR…"}
{"type":"thinking_delta","agentId":"main","text":"I fan out into three parallel reviewers."}
{"type":"tool_call","agentId":"main","name":"review","input":{"areas":["bugs","perf","security"]}}
{"type":"agent_spawn","agentId":"bugs","parentId":"main","task":"Find bugs in the diff"}
watching is passive: the web views, the explain layer and every exporter only read the stream; the one write path back into a live run is the permission gate, and that answer comes from you
the modules
small parts on one backbone
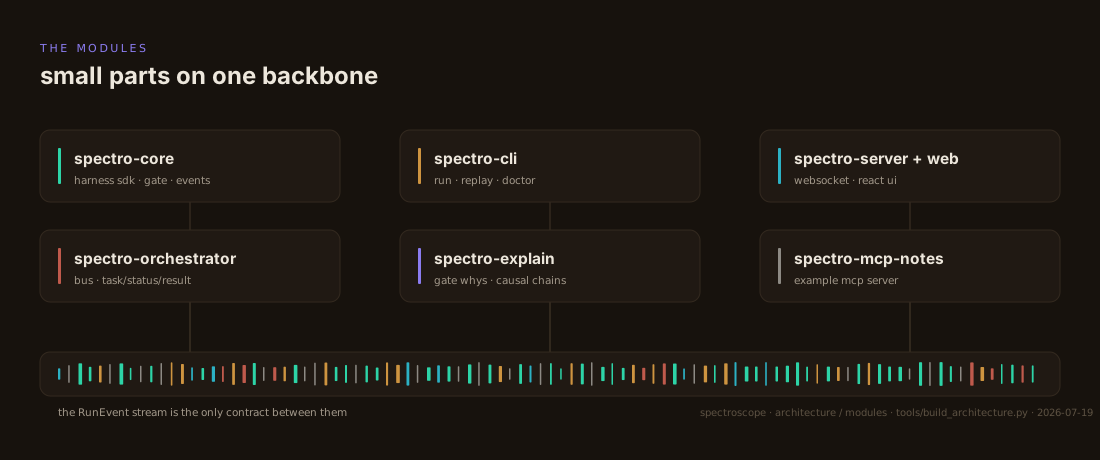
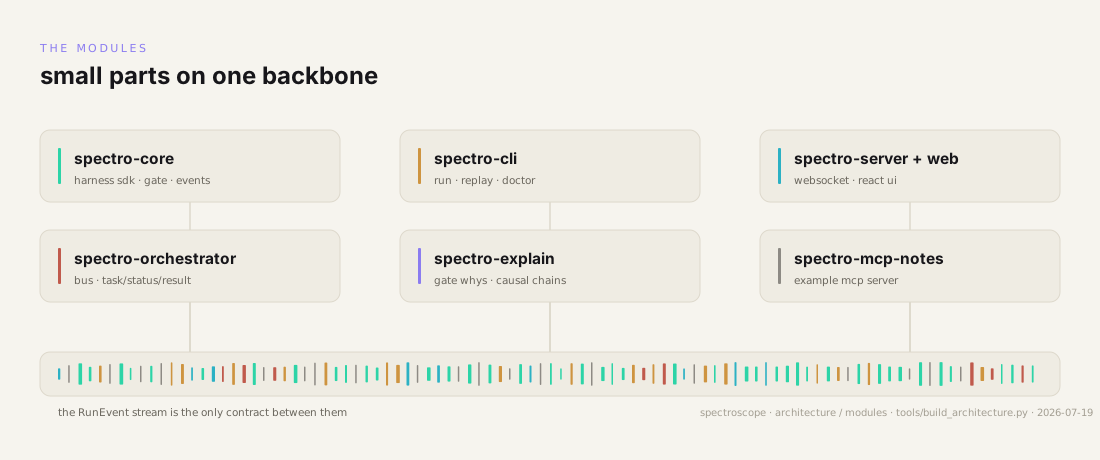
The RunEvent stream is the only contract between them.
spectro-core
The harness SDK: agents, tools, the permission gate, the typed event stream.
spectro-cli
The spectro launcher: run, replay, doctor.
spectro-server + web
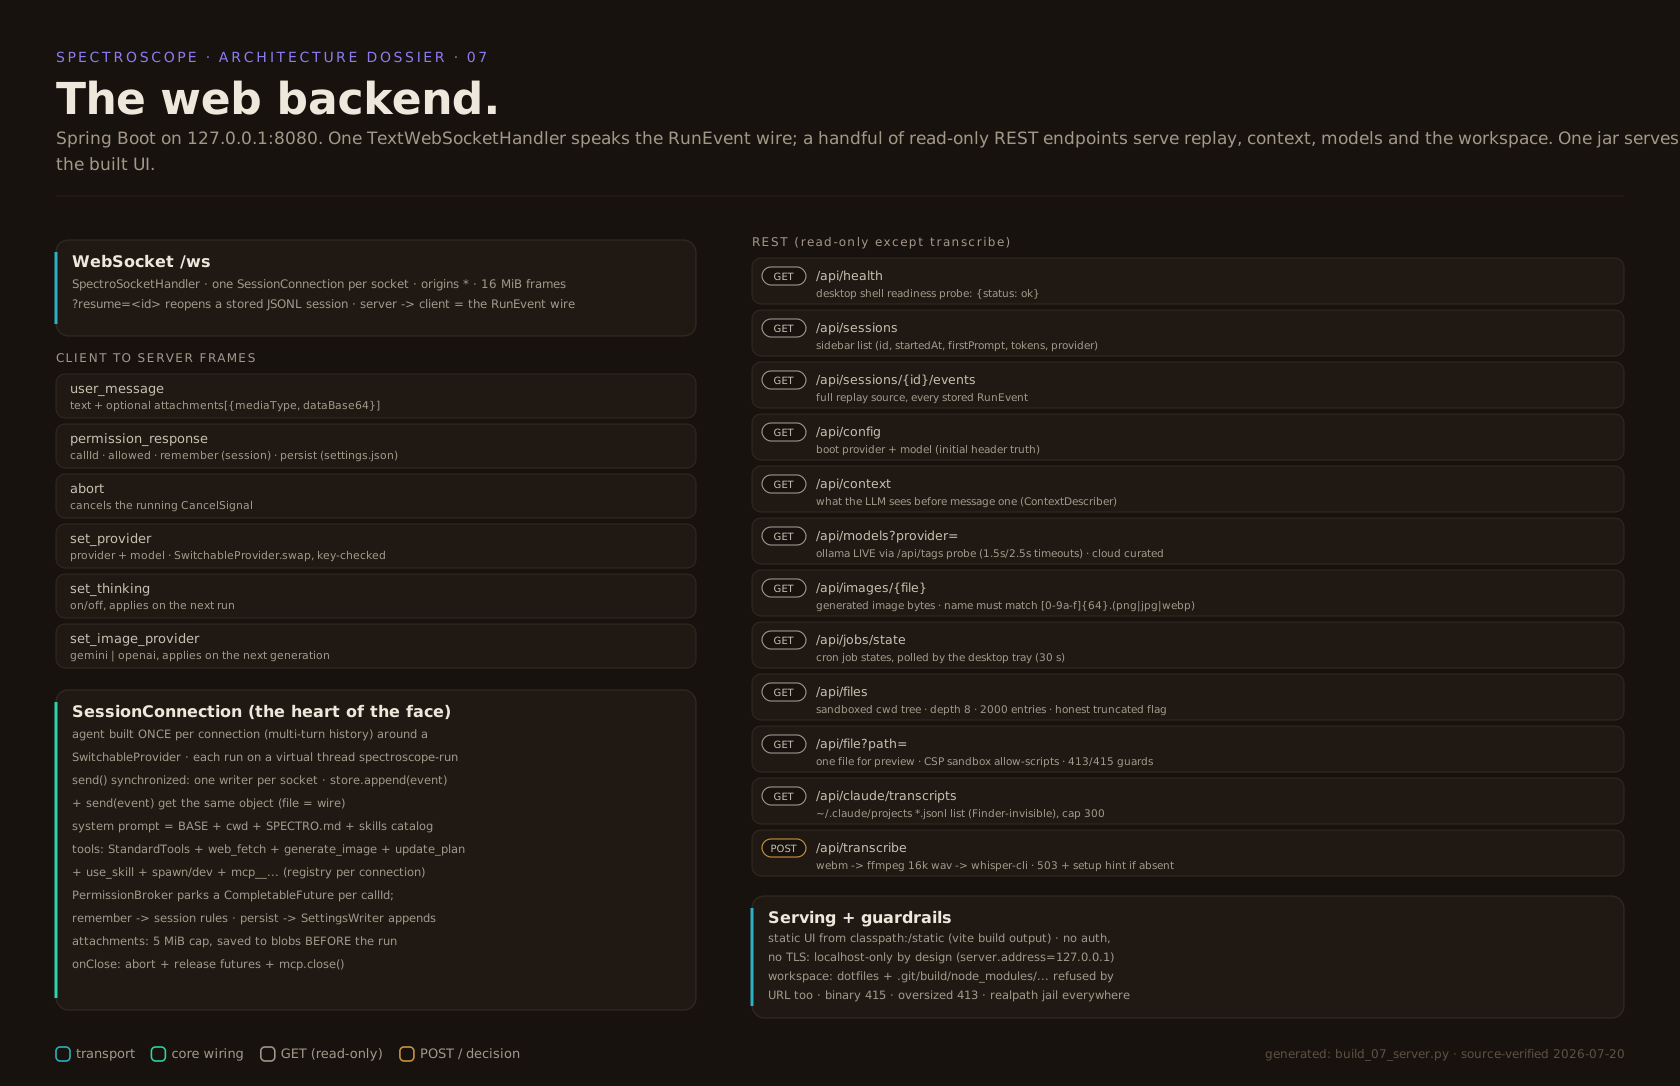
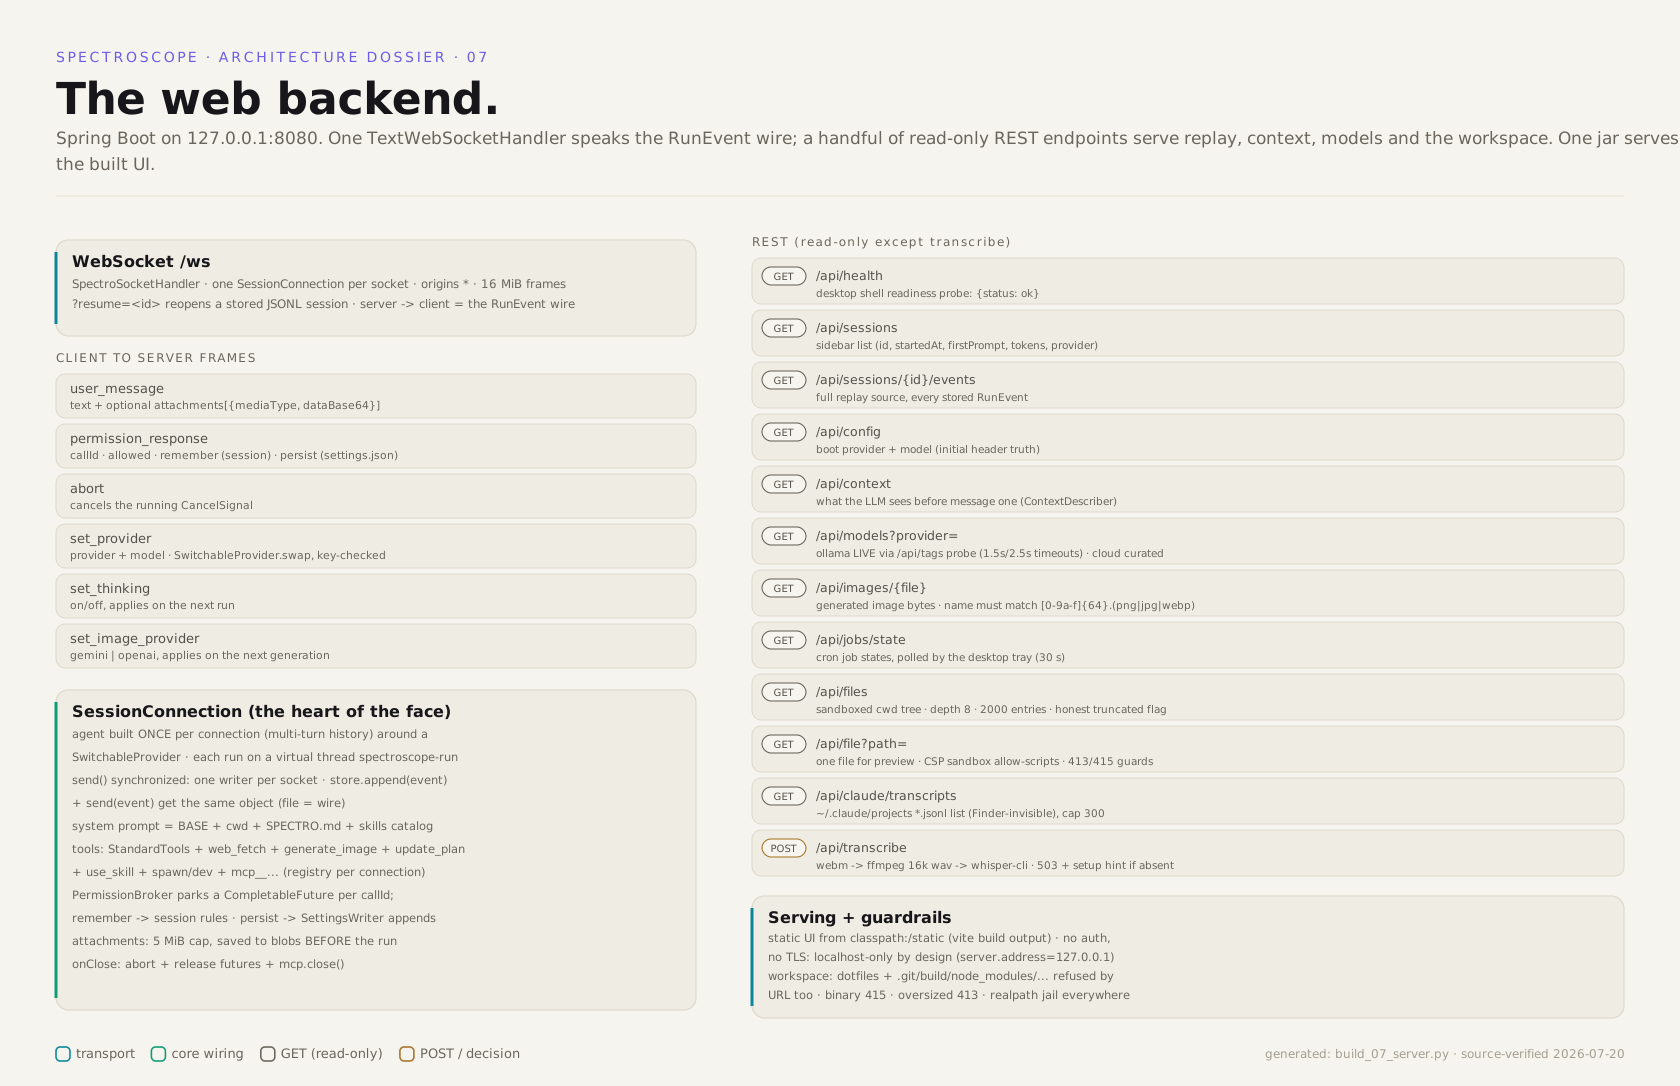
The local cockpit: chat, Spectrum, Trace, graph, text feed and the Lab over one WebSocket.
spectro-orchestrator
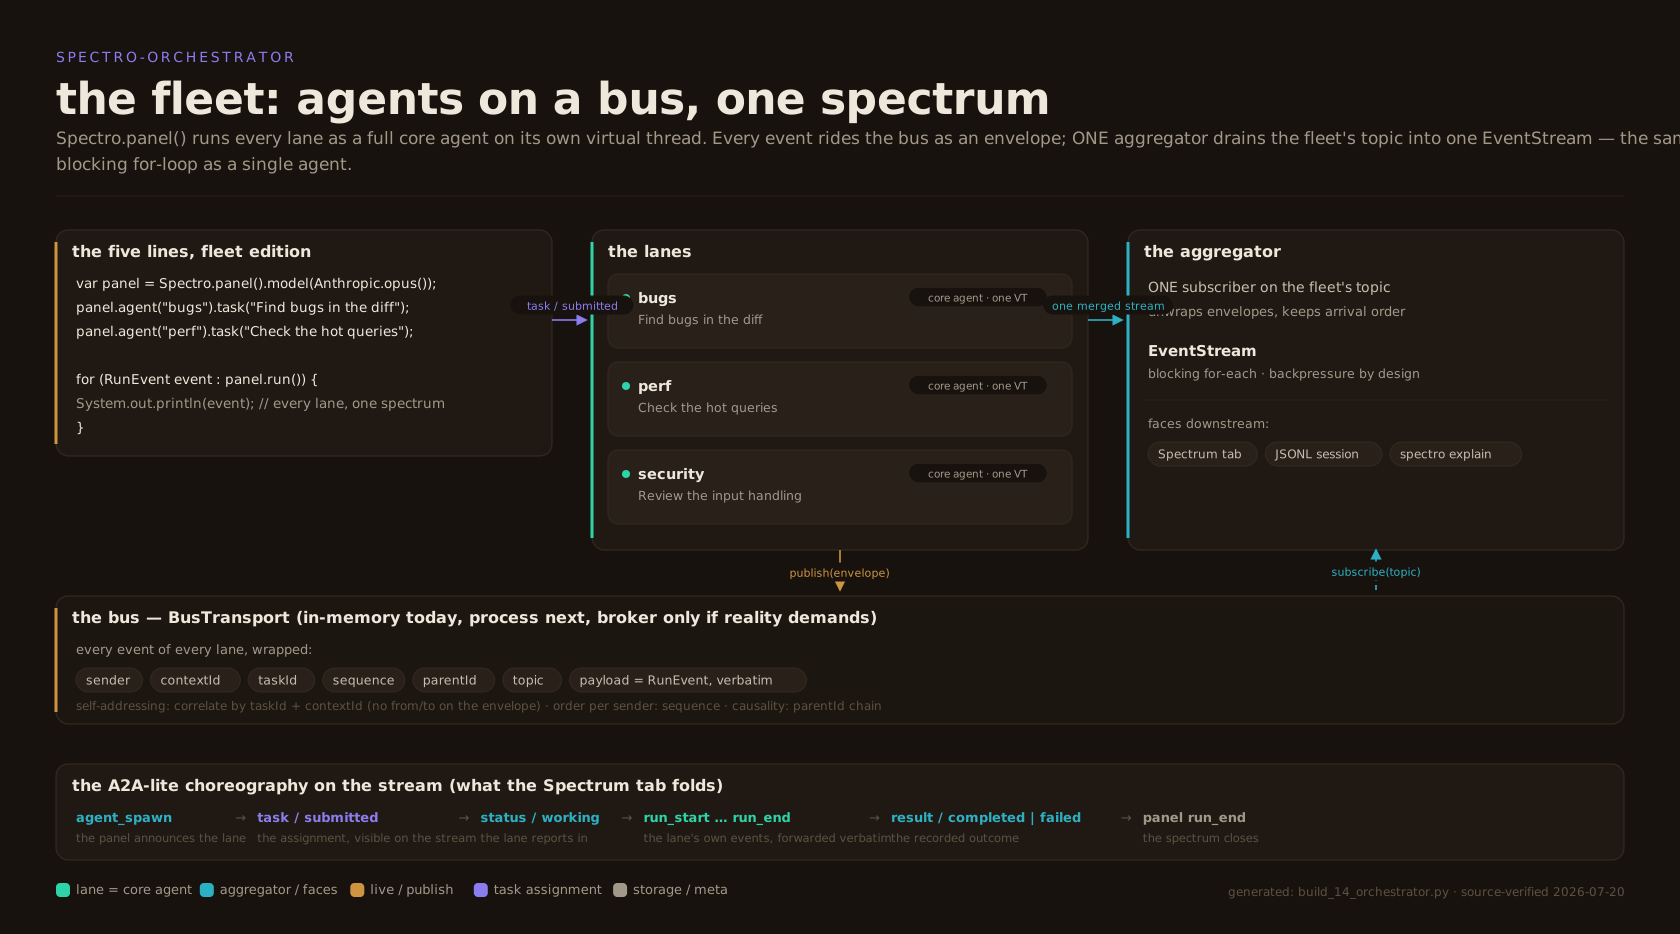
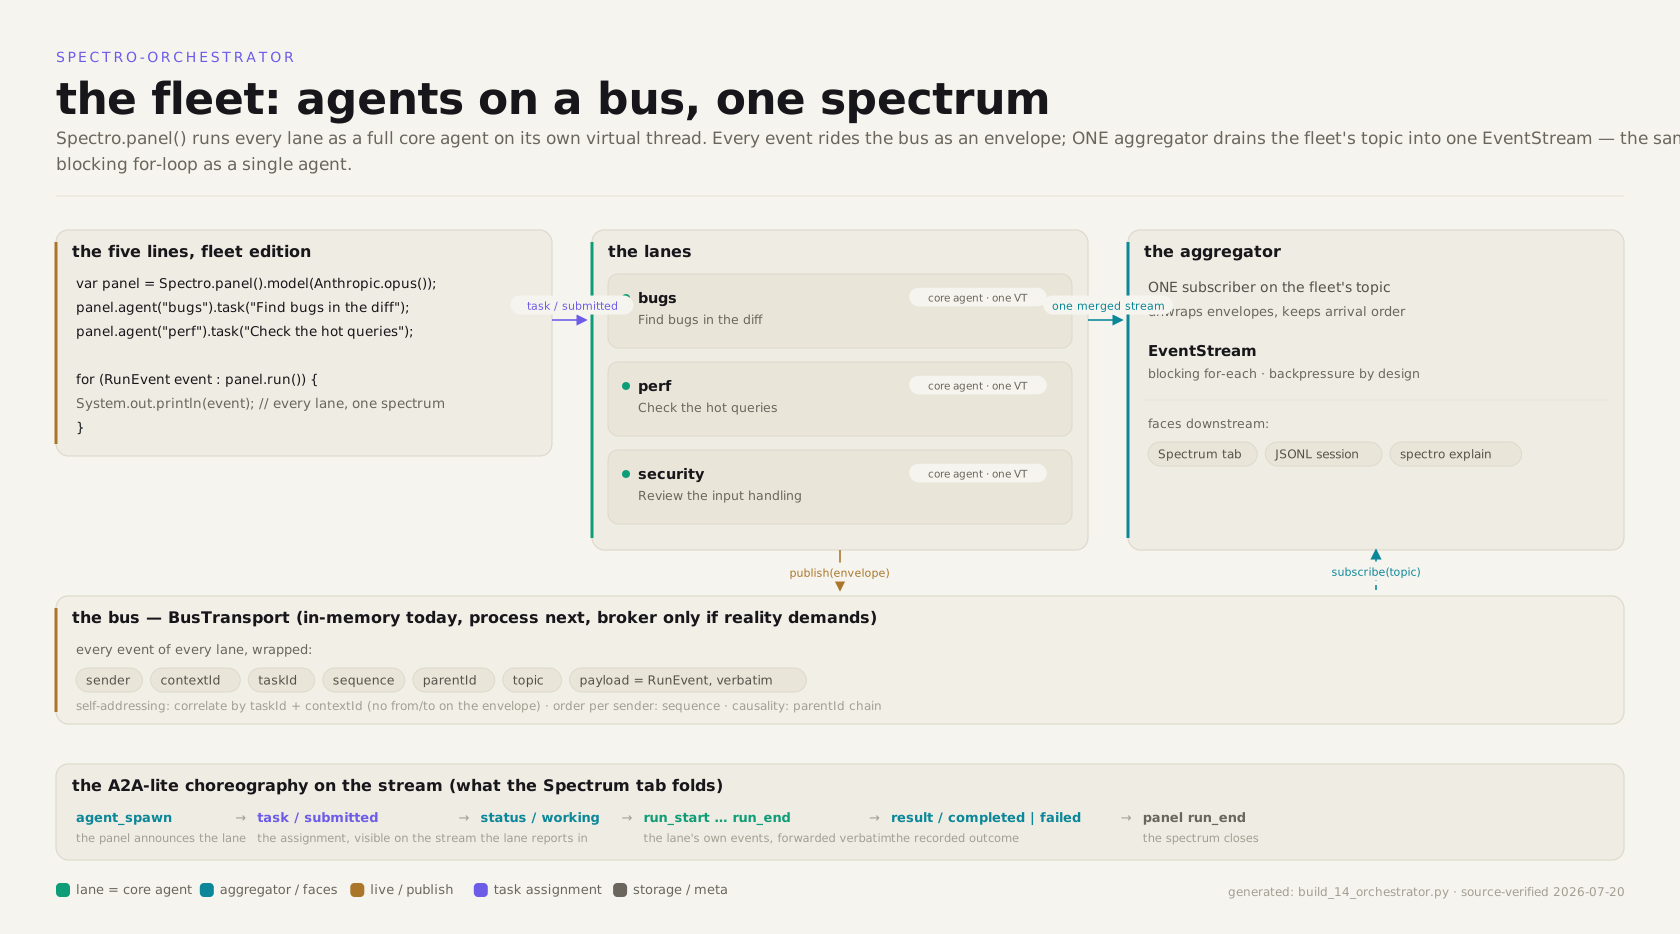
Small agents on one bus, exchanging task, status and result messages.
spectro-explain
The why layer: gate explanations and causal chains, computed from the stream.
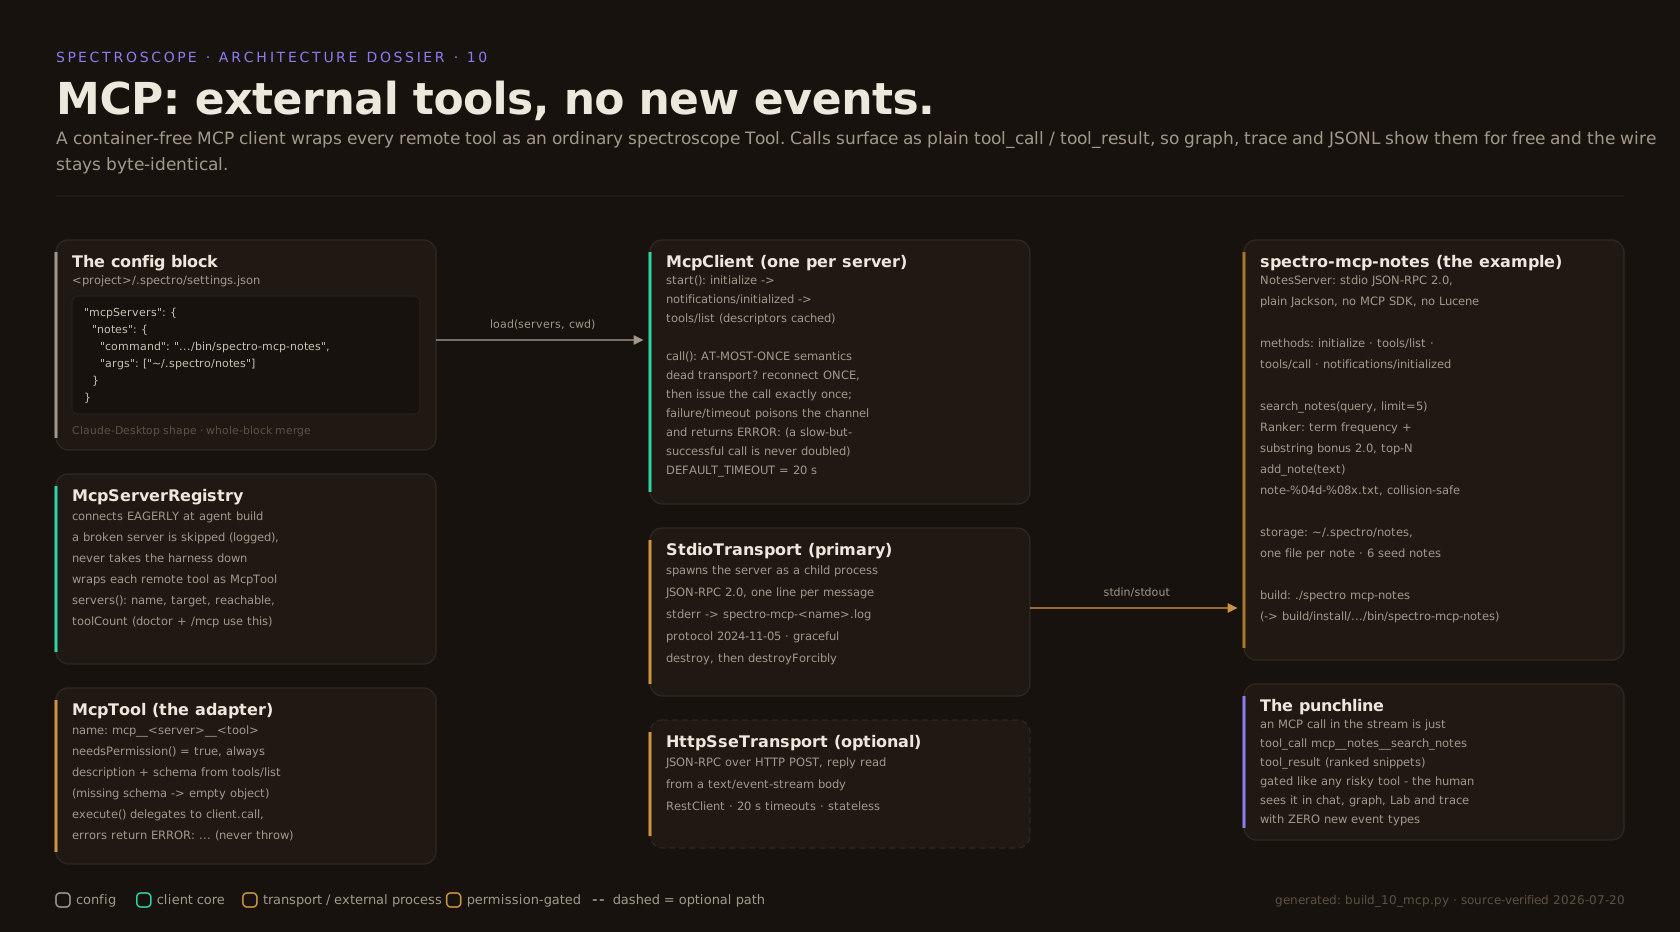
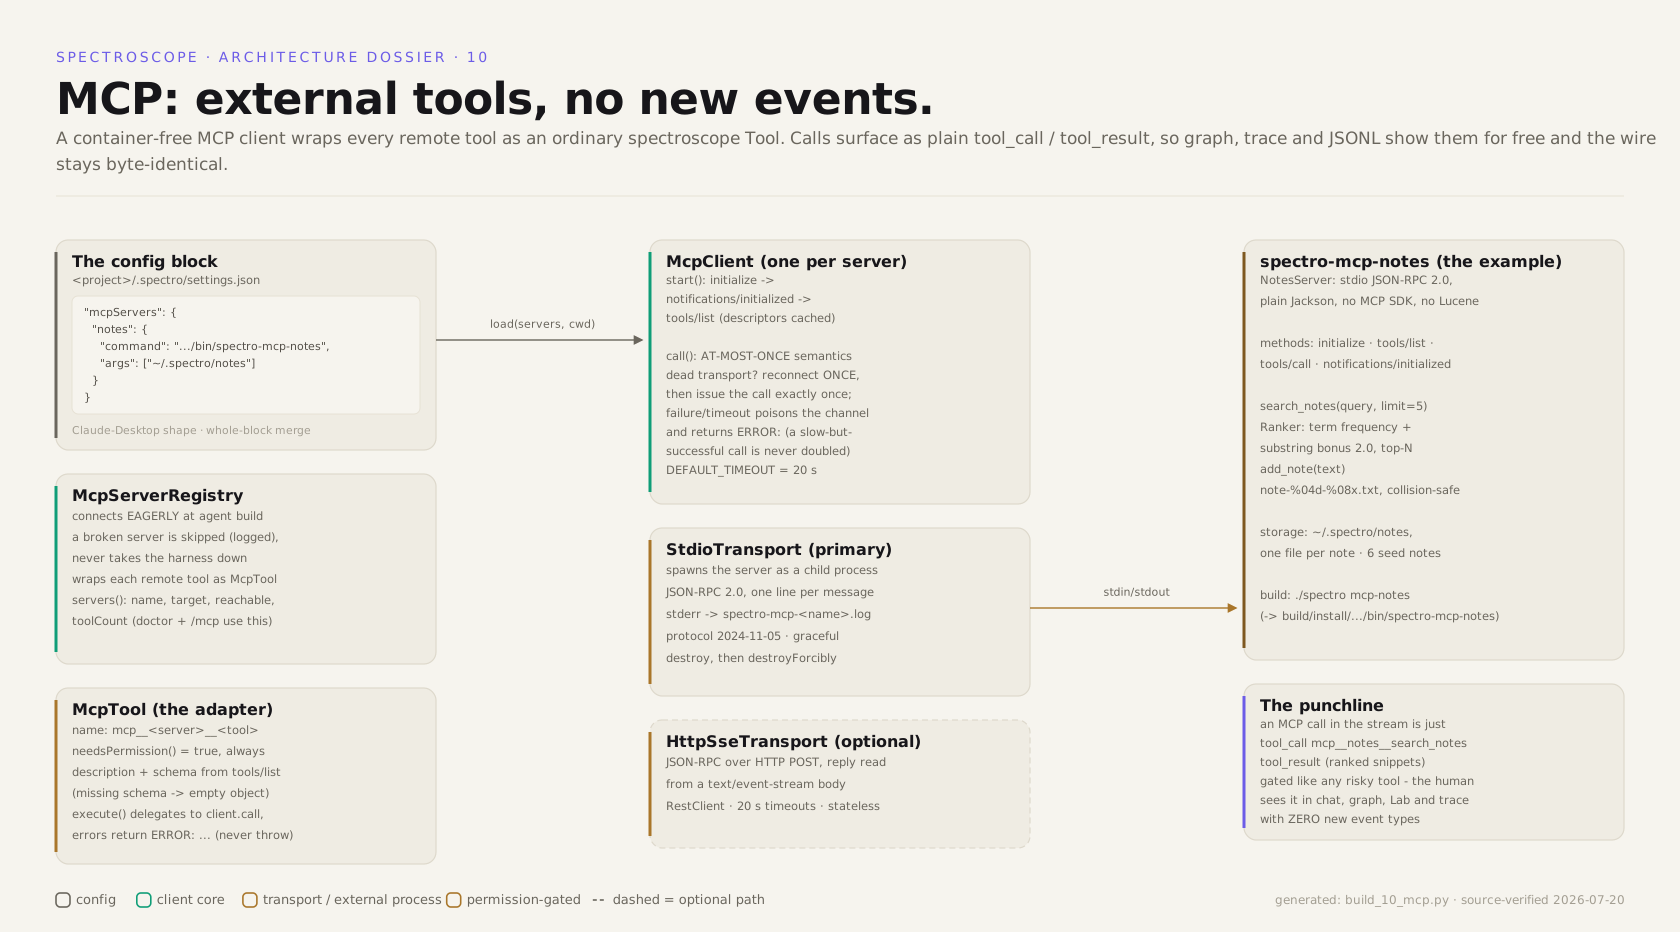
spectro-mcp-notes
A worked MCP server example to copy from.
the stack
runs on Spring. almost nothing else.
spectro-core is a plain Java 21 library: you instantiate agents with
new, and Spring appears in the core only as its HTTP client.
The server face is one ordinary Spring Boot app that serves the web UI
from its own jar. The full dependency list is Jackson, Spring's web
client, the Anthropic SDK, a cron parser and slf4j; the CLI adds picocli,
the faces add logback. There is no agent framework underneath and no
vector database to feed.
An observability tool should be observable itself: five small Gradle modules, one typed stream, and every run on disk as JSONL you can open in an editor.
spectro web
the cockpit, in one capture
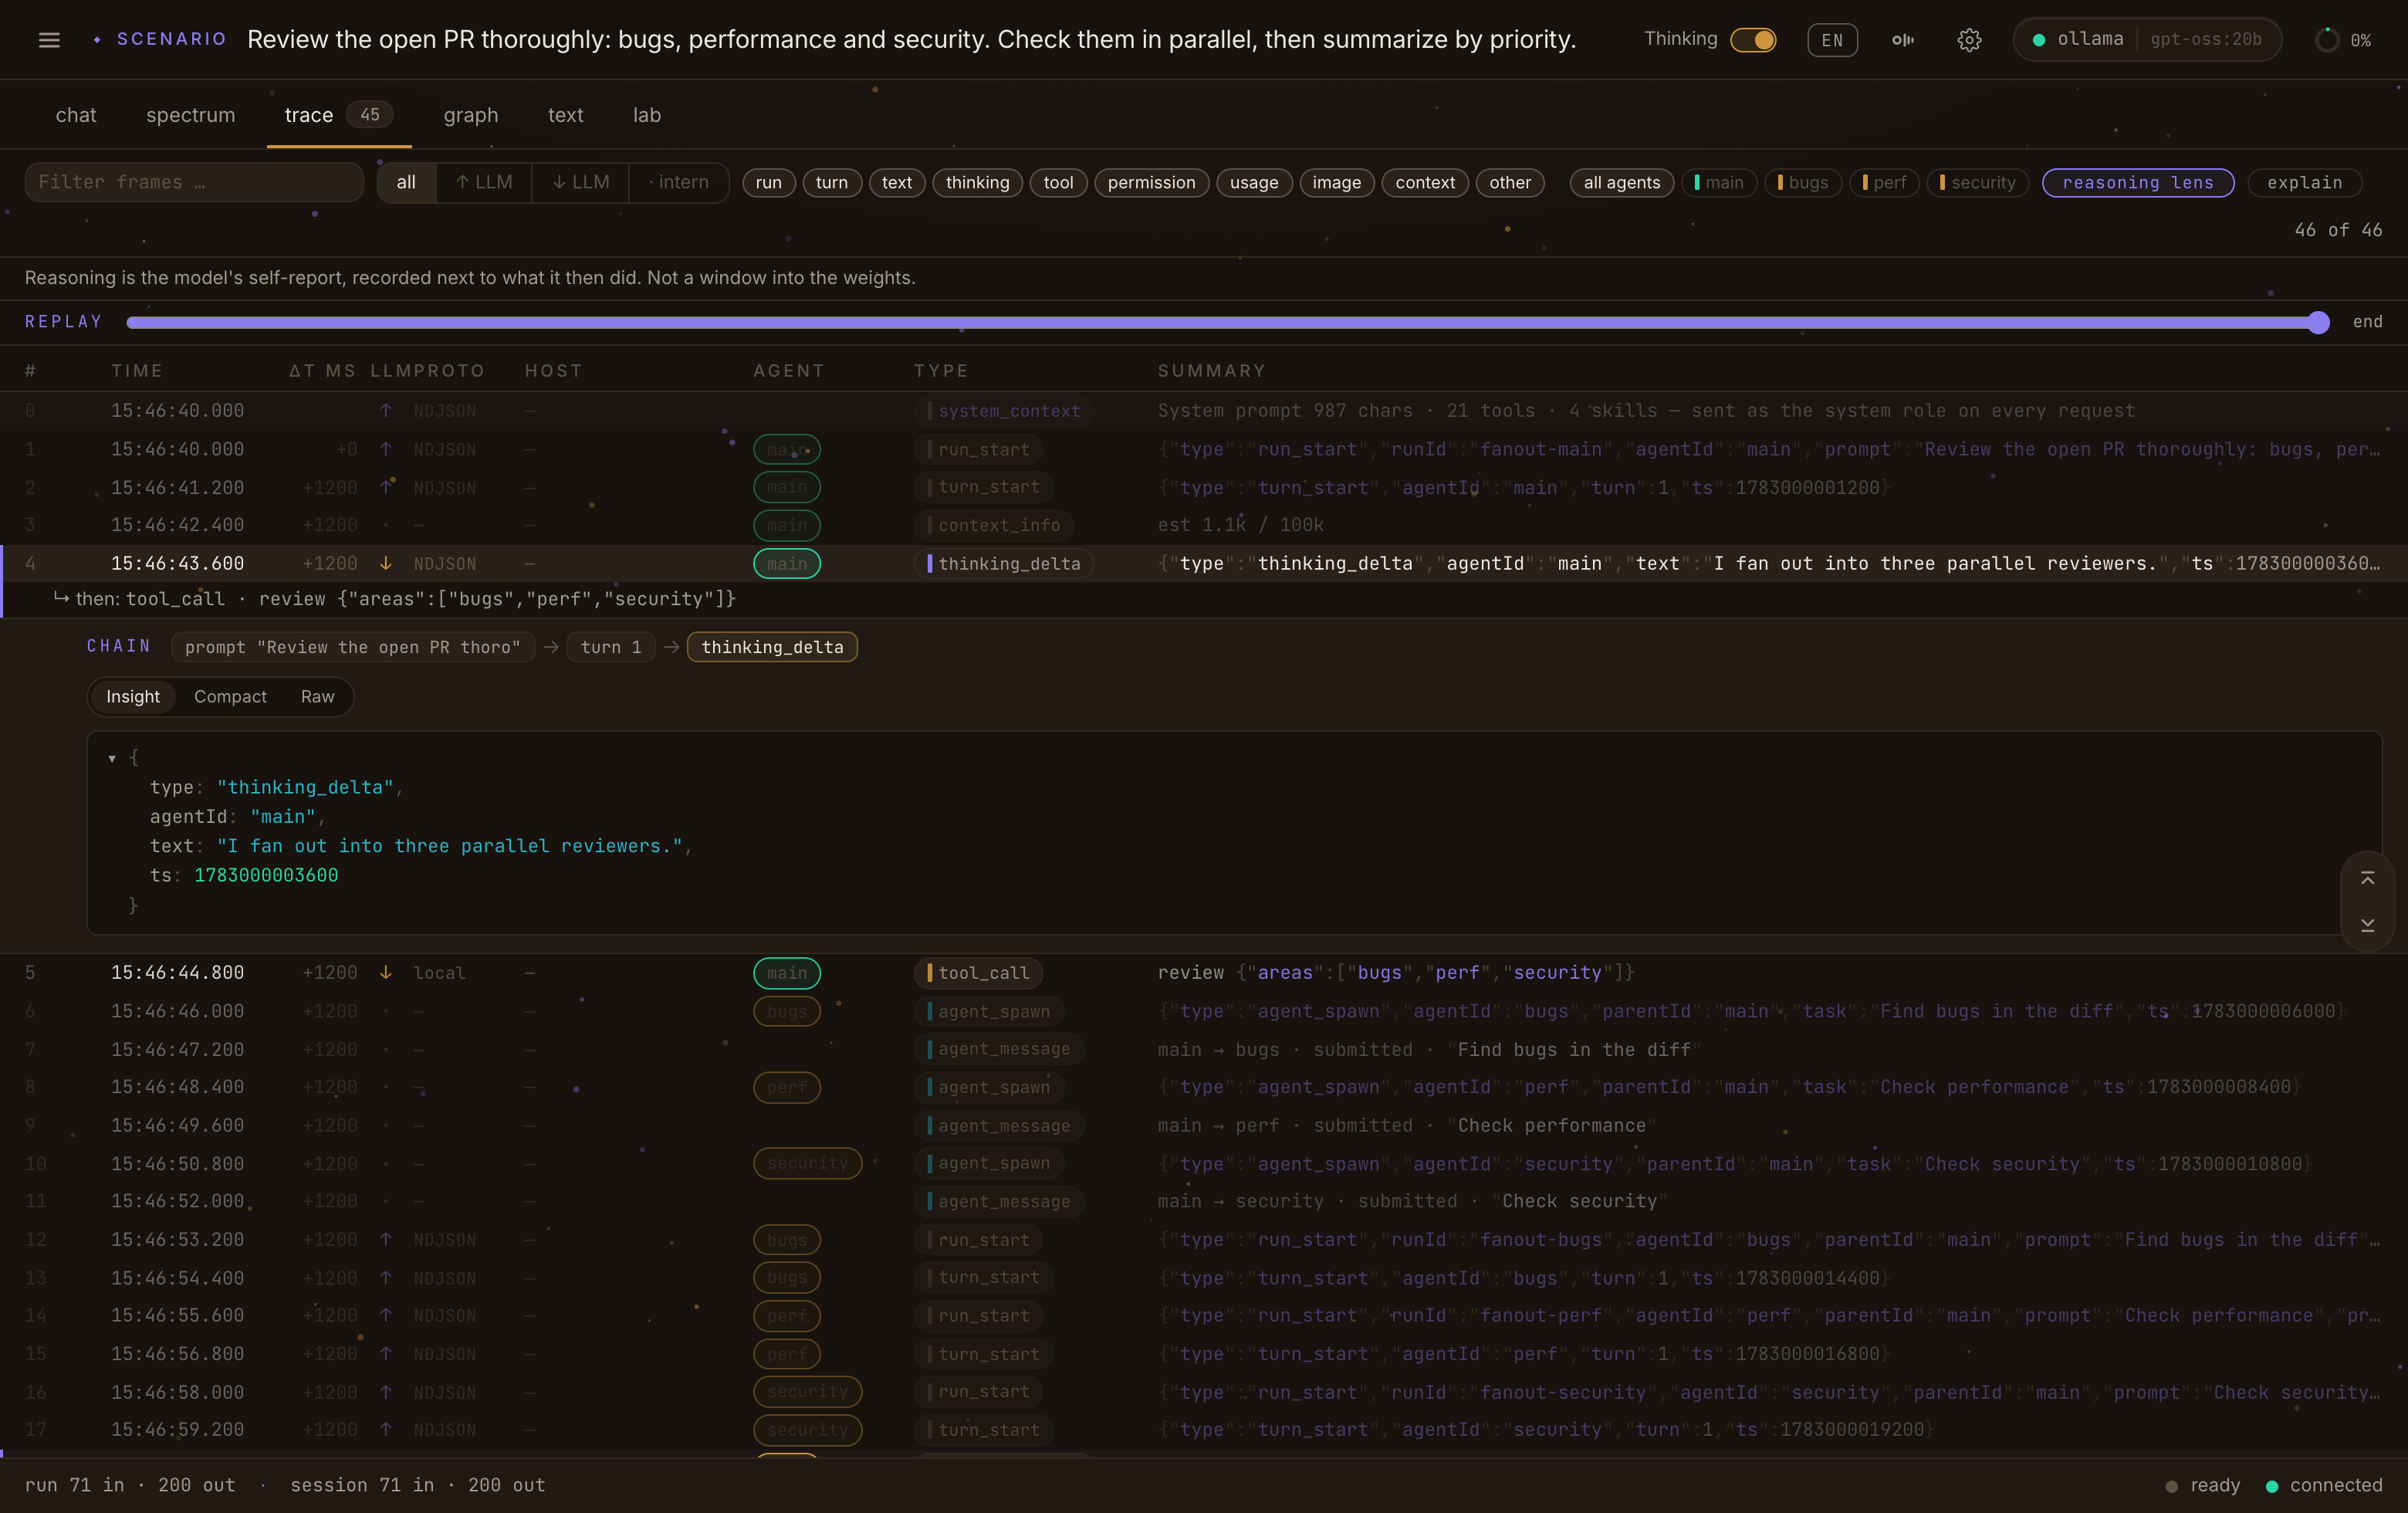
This is the Trace tab replaying a bundled demo scenario, with the reasoning lens active: thinking events in the foreground, everything else dimmed, and each thought pinned to the tool call that followed it. Read the thinking for what it is: the model's self-report, not a window into the weights. Scenarios are scripted runs, so you can explore every surface of the app before you connect a model.
more captures, light and dark: spectroscope.ai · the gallery
the simulator
learn the harness by driving one
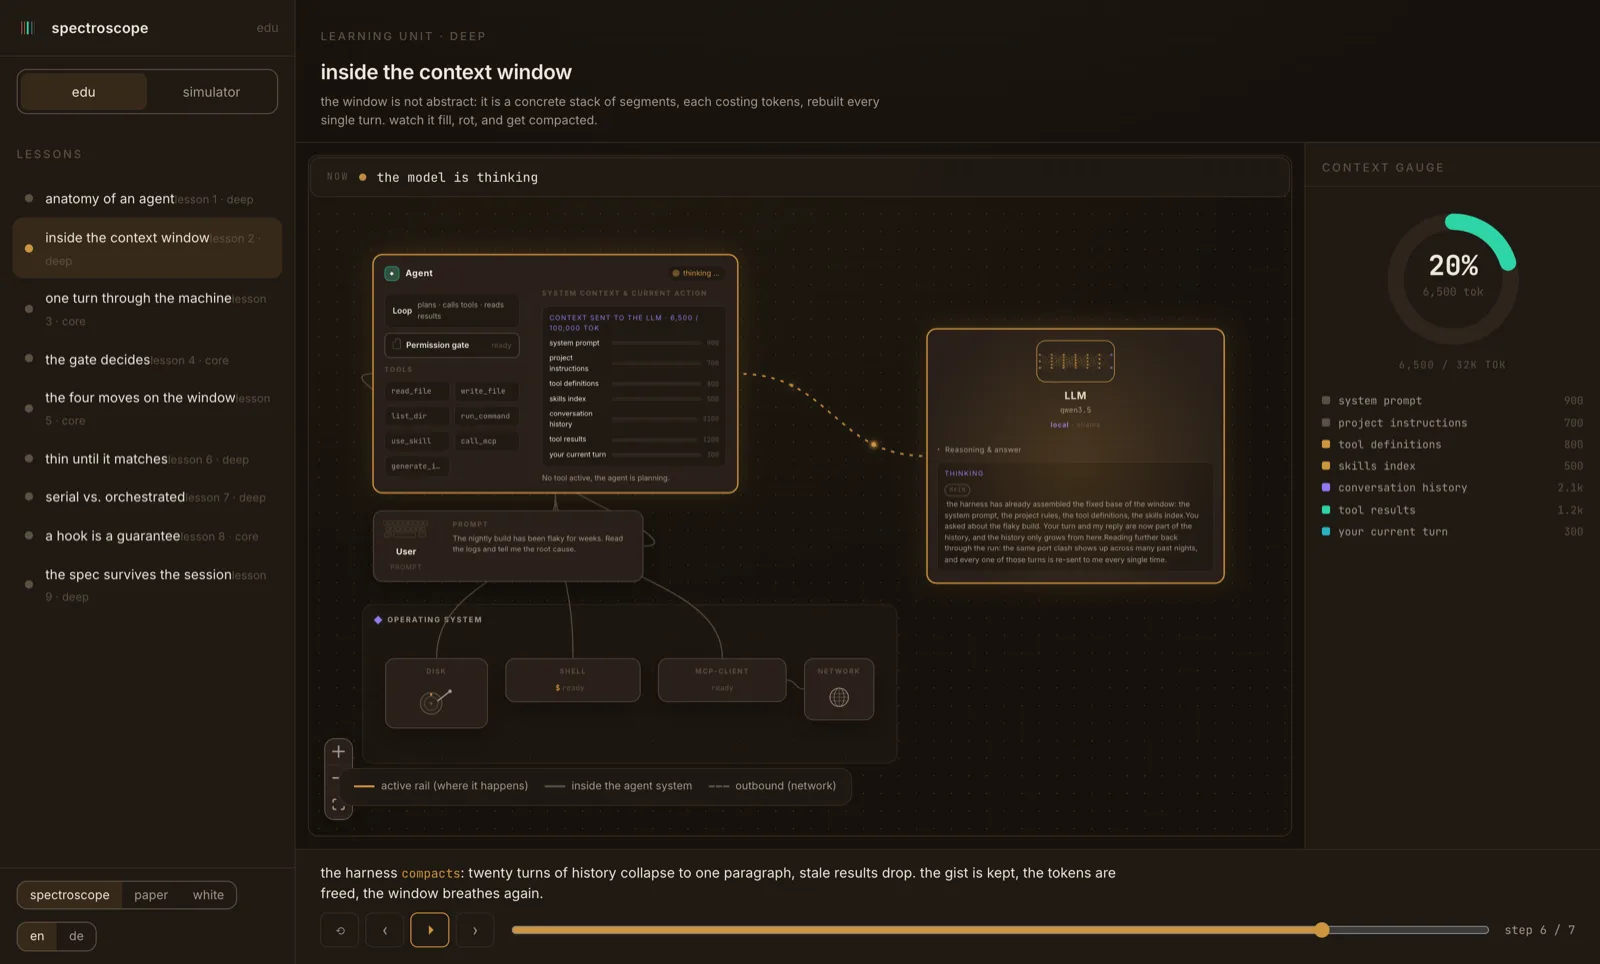
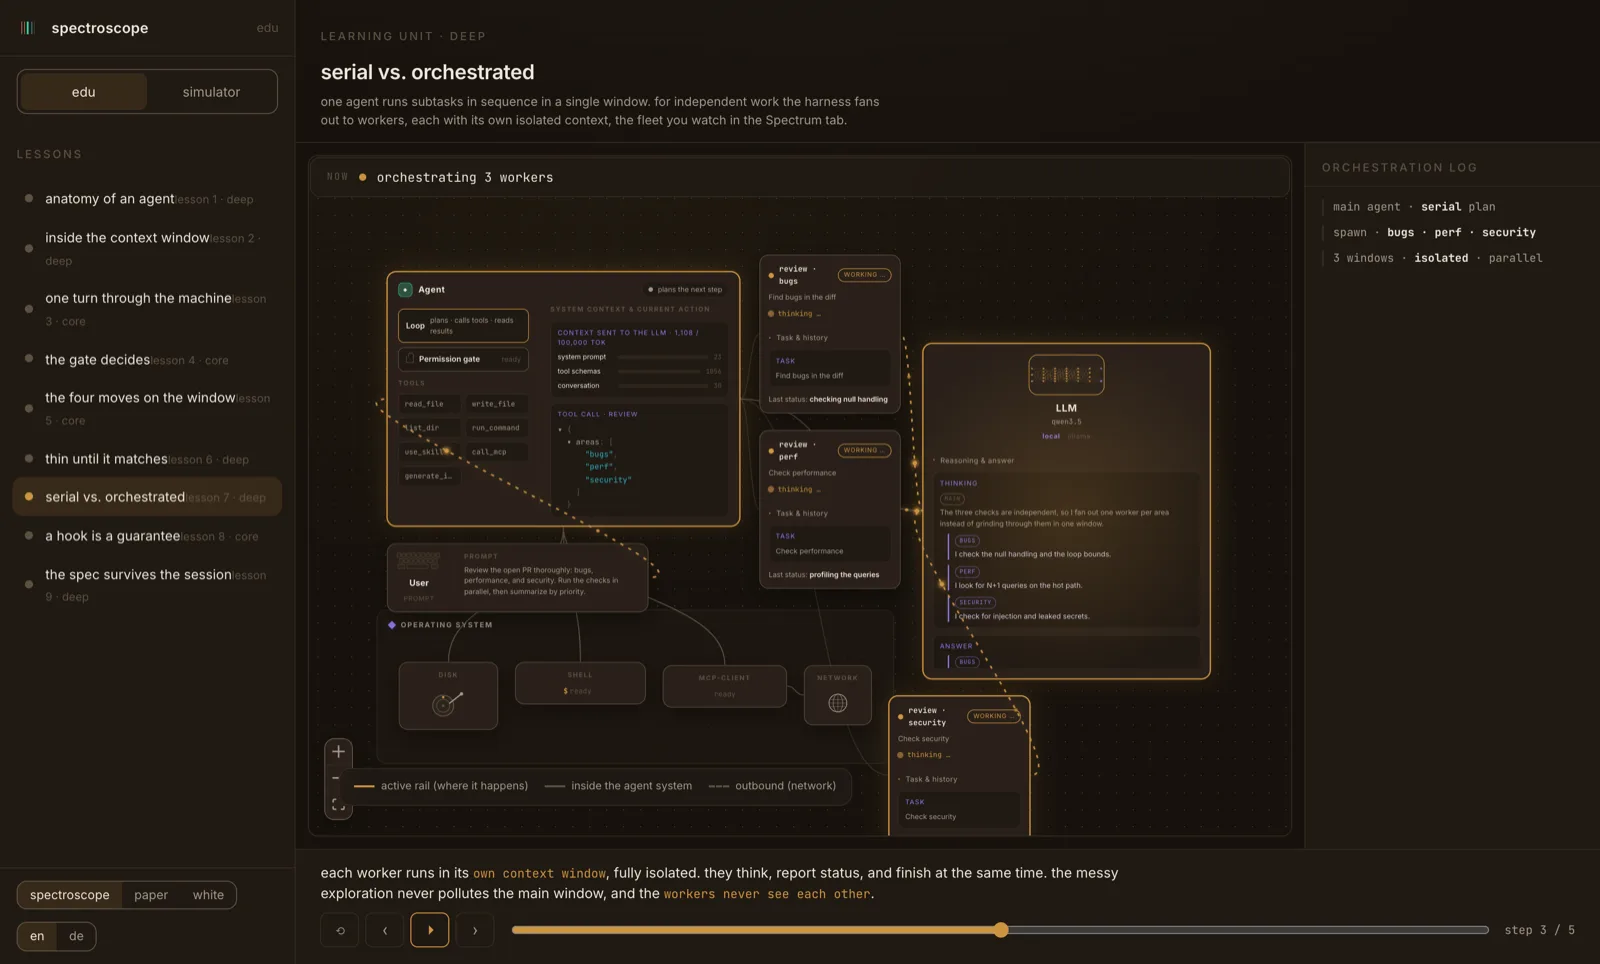
edu.spectroscope.ai is spectroscope with the backend taken out: the same system map, trace and jsonl views the real cockpit draws, replaying scripted agent runs you step, play and scrub. Nine short lessons build an agent up one part at a time: the context window, the loop, the permission gate, an orchestrated fan-out. No model, no keys, no server. It runs from static files, the way the product does.
open the simulator →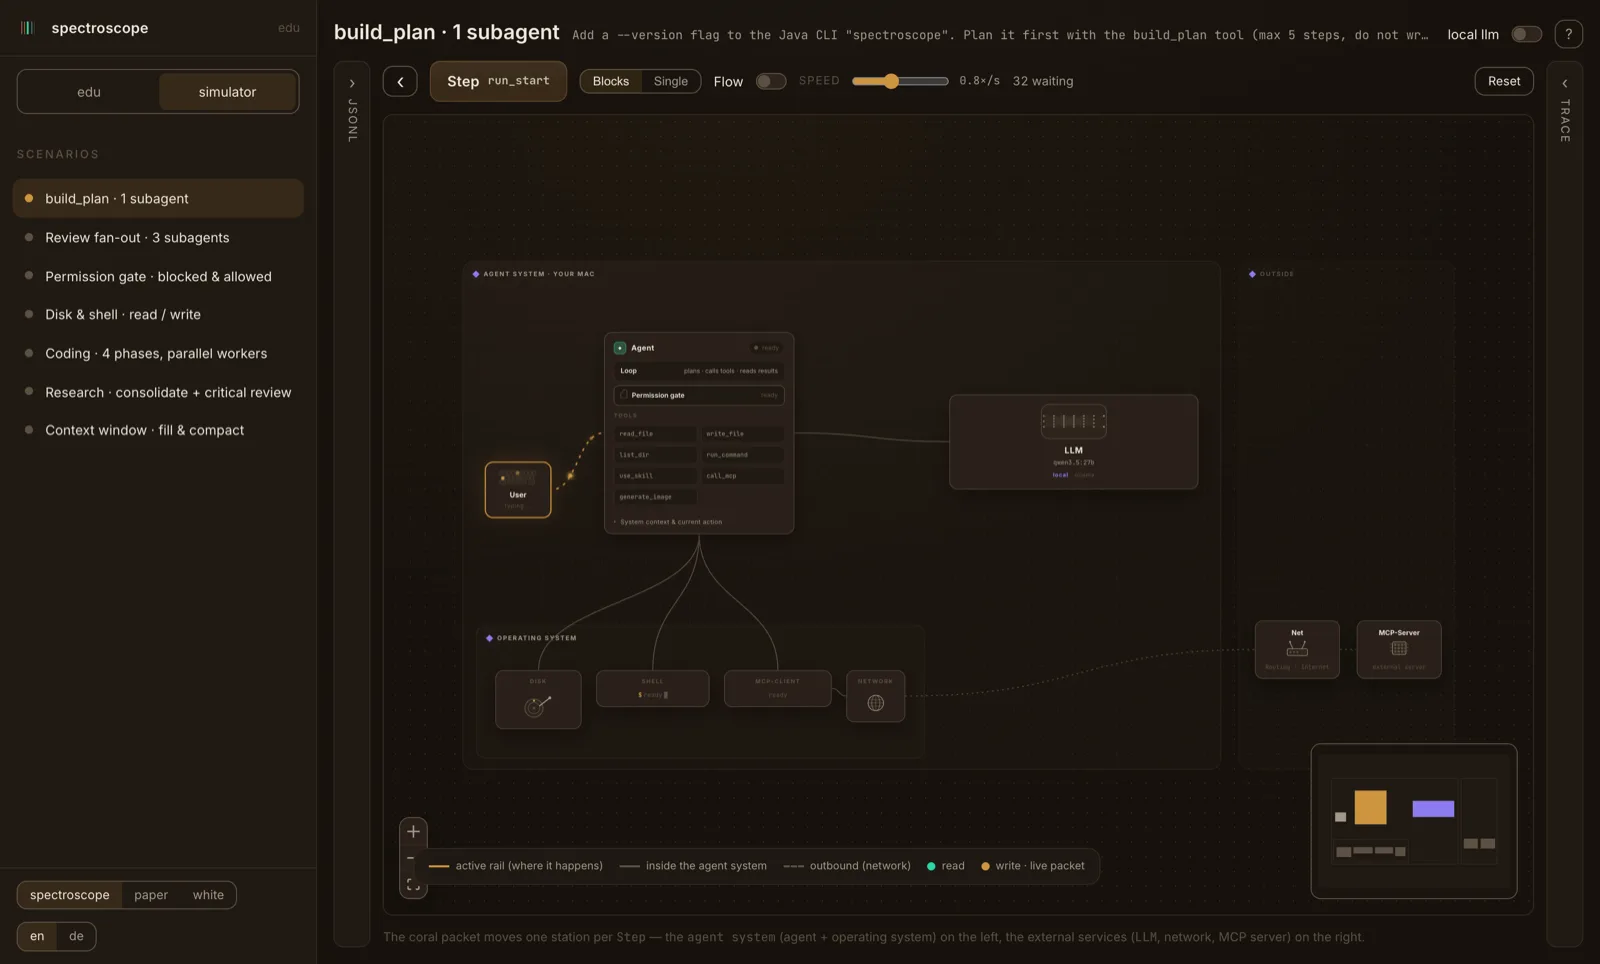
backend-free
Every run is a scripted replay, so nothing leaves the browser. Open every surface without a key or a server.
trace + jsonl in lockstep
Open the side drawers to read the same run two more ways: the raw jsonl event stream and the causal trace, both stepping with the map.
the provider flip
Flip the model from local to remote and watch the llm card cross the network boundary. The run is the same; only the topology changes.
nine lessons, rendered with the same cards the simulator draws, so a motif you learn here is the one you meet in the running app
run a fleet
start the agents, then watch them as one
A fleet is many agents on one hub. You start them — in code or as processes — and enter the fleet in the cockpit like a session, where each agent is one spectral line on the canvas with its own trace. Being honest about today: the cockpit is where you watch; you drive a fleet from code, the CLI, and a few local REST endpoints. In-cockpit buttons for spawn and stop are next; answering a parked permission gate already has one.
1 · turn on the hub and the cockpit
$ SPECTRO_HUB_PORT=7000 spectro web   # cockpit on :8080, fleet hub on loopback :7000
# open http://localhost:8080 → sidebar: fleets (empty until an agent connects)
a fleet in code
One panel, many lanes, one merged stream. Export SPECTRO_HUB and every lane mirrors to the hub live.
var fleet = Spectro.panel()
    .model(Anthropic.opus())
    .workspace(Path.of("/tmp/scratch"));
fleet.agent("reviewer").task("Review the diff");
fleet.agent("tester").task("Run the tests");

// all lanes, one stream
for (RunEvent e : fleet.run())
    System.out.println(e);
a fleet of processes
Each node is its own process; a shared --context groups them into one fleet on the hub.
$ export SPECTRO_HUB=localhost:7000
$ spectro node -p "Review the diff" \
  --context pr-42 --id reviewer --role reviewer
$ spectro node -p "Run the tests" \
  --context pr-42 --id tester --role tester
2 · steer it — spawn, stop, and answer a parked permission gate, over loopback-only REST
# spawn a readonly node from the cockpit (opt-in: SPECTRO_ALLOW_SPAWN=true)
$ curl -X POST localhost:8080/api/fleet/nodes \
    -H 'content-type: application/json' \
    -d '{"prompt":"scan the logs","context":"pr-42"}'

# stop a running node (best-effort; re-issue until it leaves the roster)
$ curl -X POST localhost:8080/api/fleet/reviewer/stop -H 'content-type: application/json'

# a node in --permissions ask PARKS each tool; answer it (or click the cockpit's gate bar)
$ curl -X POST localhost:8080/api/fleet/reviewer/gate \
    -H 'content-type: application/json' -d '{"callId":"c1","allow":true}'
the control plane is loopback-only and best-effort by design: the hub has no ack, so a stop is idempotent and a gate answer is "sent, not confirmed"; a node the hub can no longer reach denies its own parked gates and exits
status
where the project stands
v0.15.5 is out. The harness, the CLI, the web
cockpit and the scenario player exist and are under test
(6949 JUnit and 10445 vitest checks, measured on the release tree of v0.15.5 on 2026-10-14); the
source is public on GitHub, and the libraries are on Maven Central as dev.spectroscope:spectro-core and dev.spectroscope:spectro-orchestrator. This line is about watching the thing rather than reconstructing it afterwards: a state graph whose topology is fixed at compile time is drawn before the first token flows and then lit up by the run, and the real exchange between the backend and the model is recorded verbatim in a second file beside every session. This release tells the main agent that an explore helper can use the code graph, so it can hand graph questions to the helper. When the model ends its turn with a question to you, the app no longer carries the run on by itself, so your answer comes first. grep searches a file when it is given one. The chat line about a continuation has its own sentence for each reason. Everything
ships under the MIT license, which permits commercial use and closed-source forks.
session formats
twenty-one tools, twenty-one transcripts.
Before extending what spectroscope can read and write, we surveyed how other coding agents store a session: nineteen storage formats, plus seven protocols and tracing conventions that are often mistaken for storage. No two of the twenty-one products surveyed share a transcript format. The only cross-vendor transcript import found anywhere is Kilo Code reading Roo Code tasks, and that works because both descend from Cline.
The field did converge, just not here. Copilot's first move in a fresh
repository is to look for AGENTS.md, CLAUDE.md,
.cursorrules, .clinerules and several more;
Cline's own GlobalFileNames enumerates four competitors'
rule paths. Instruction files became a de facto standard. Agents agreed
on what to read and never on what to write.
Evidence grades, carried in every diagram below. C: a
real file on this machine was opened and read. S: the
implementation's own source was read. D: vendor
documentation only. A cell reading none means the survey
looked and it is not there. A cell reading ? means
unverified, and is never to be read as no.
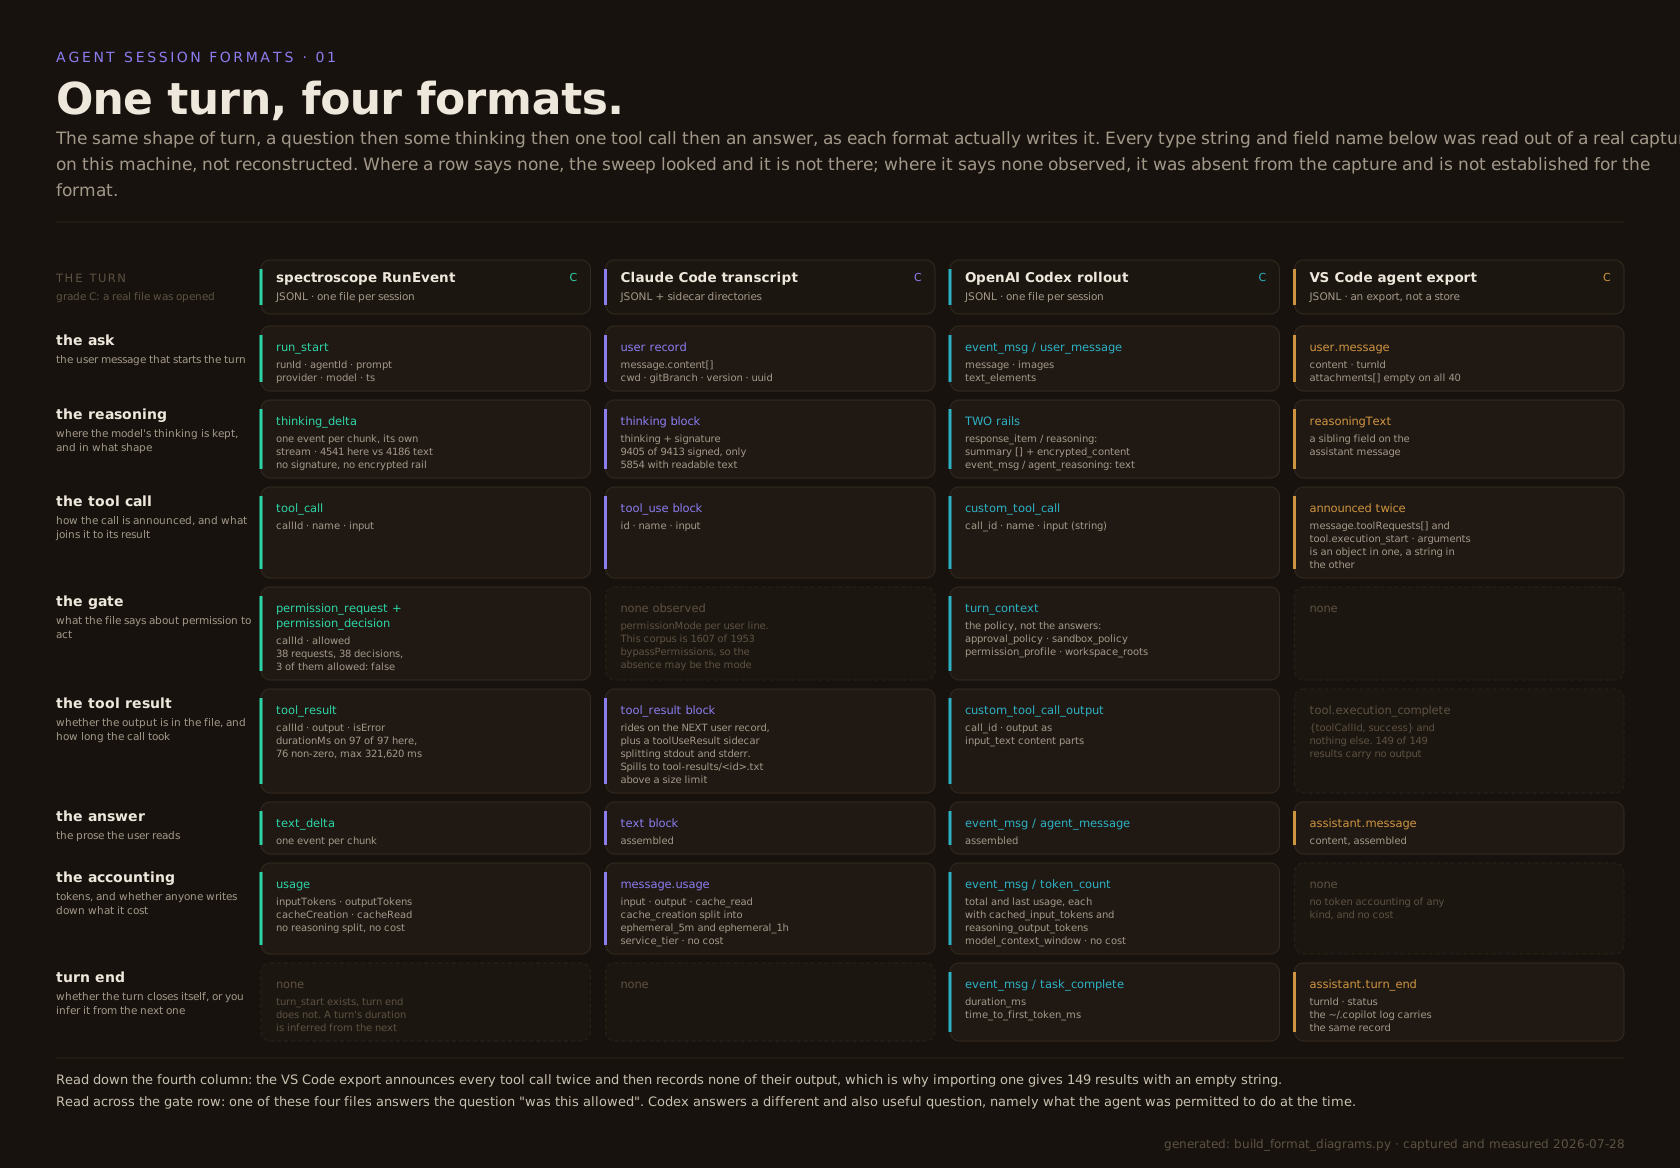
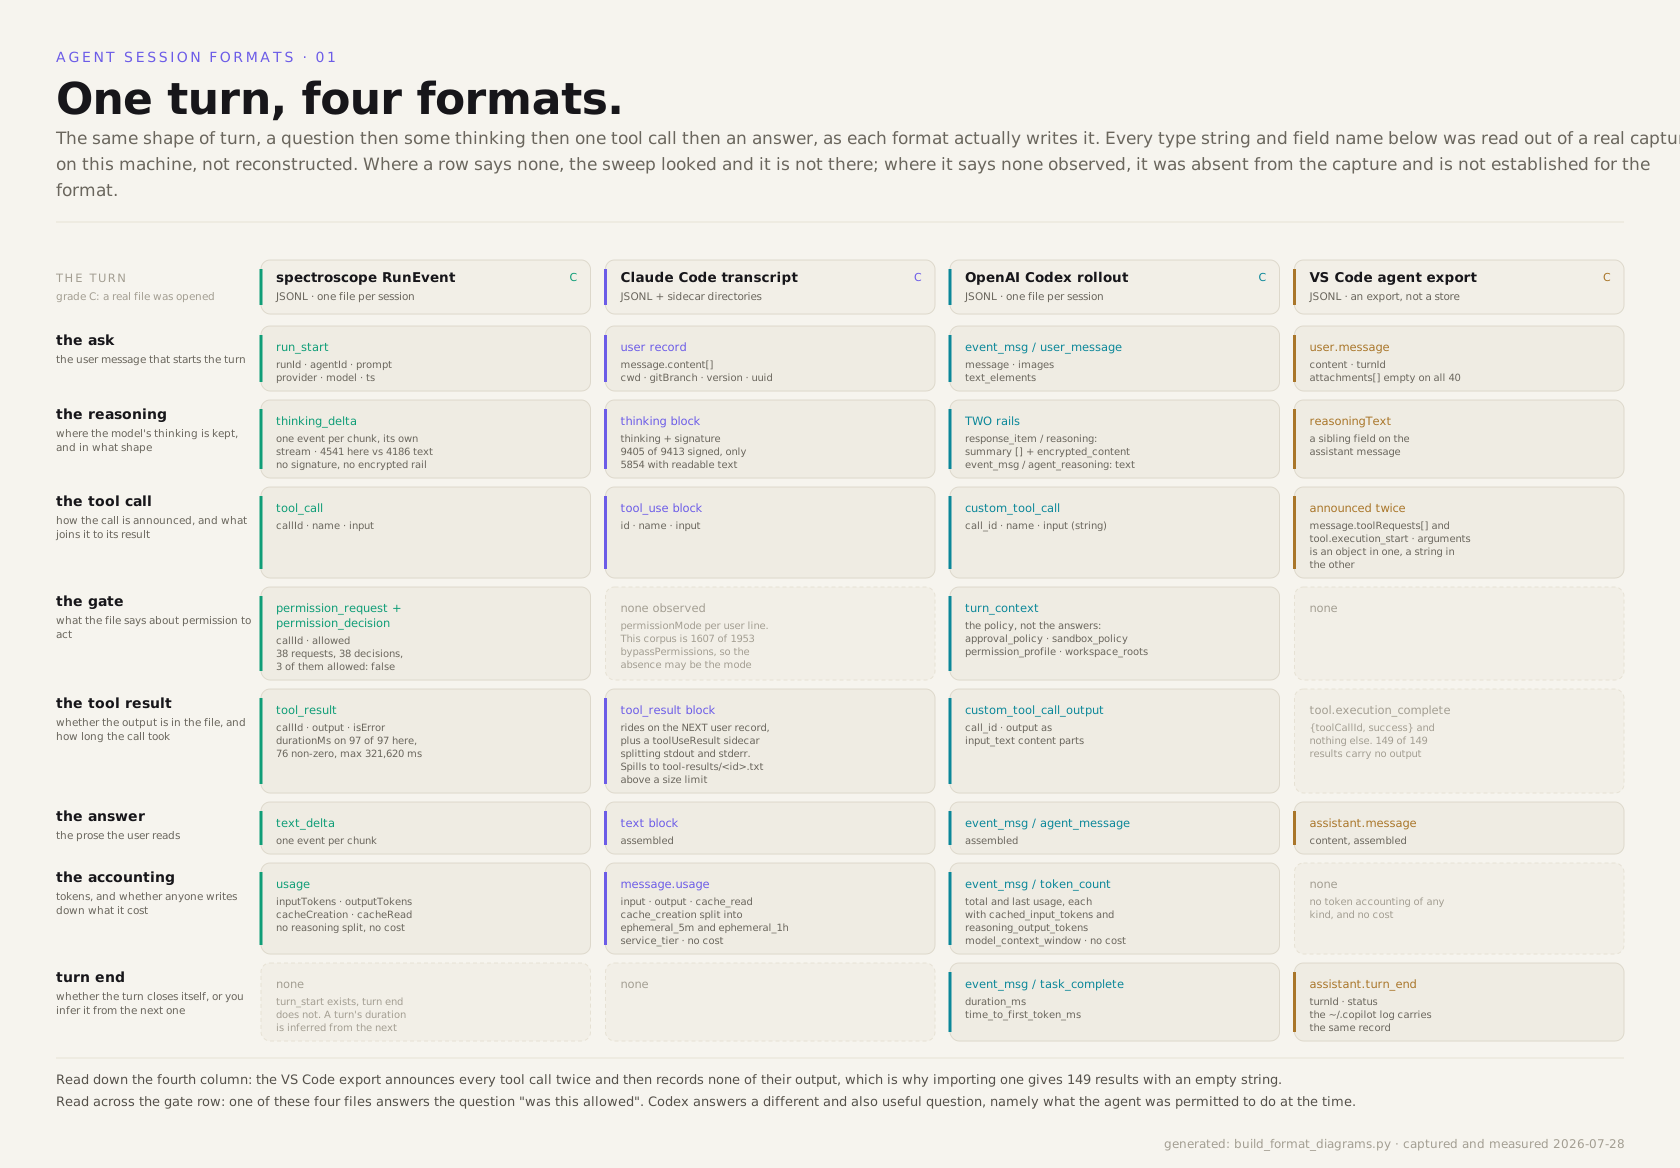
Every type string and field name above was read out of a real capture on this machine, not reconstructed. The gate row is the one that separates them: of these four files, one answers the question “was this call allowed”.
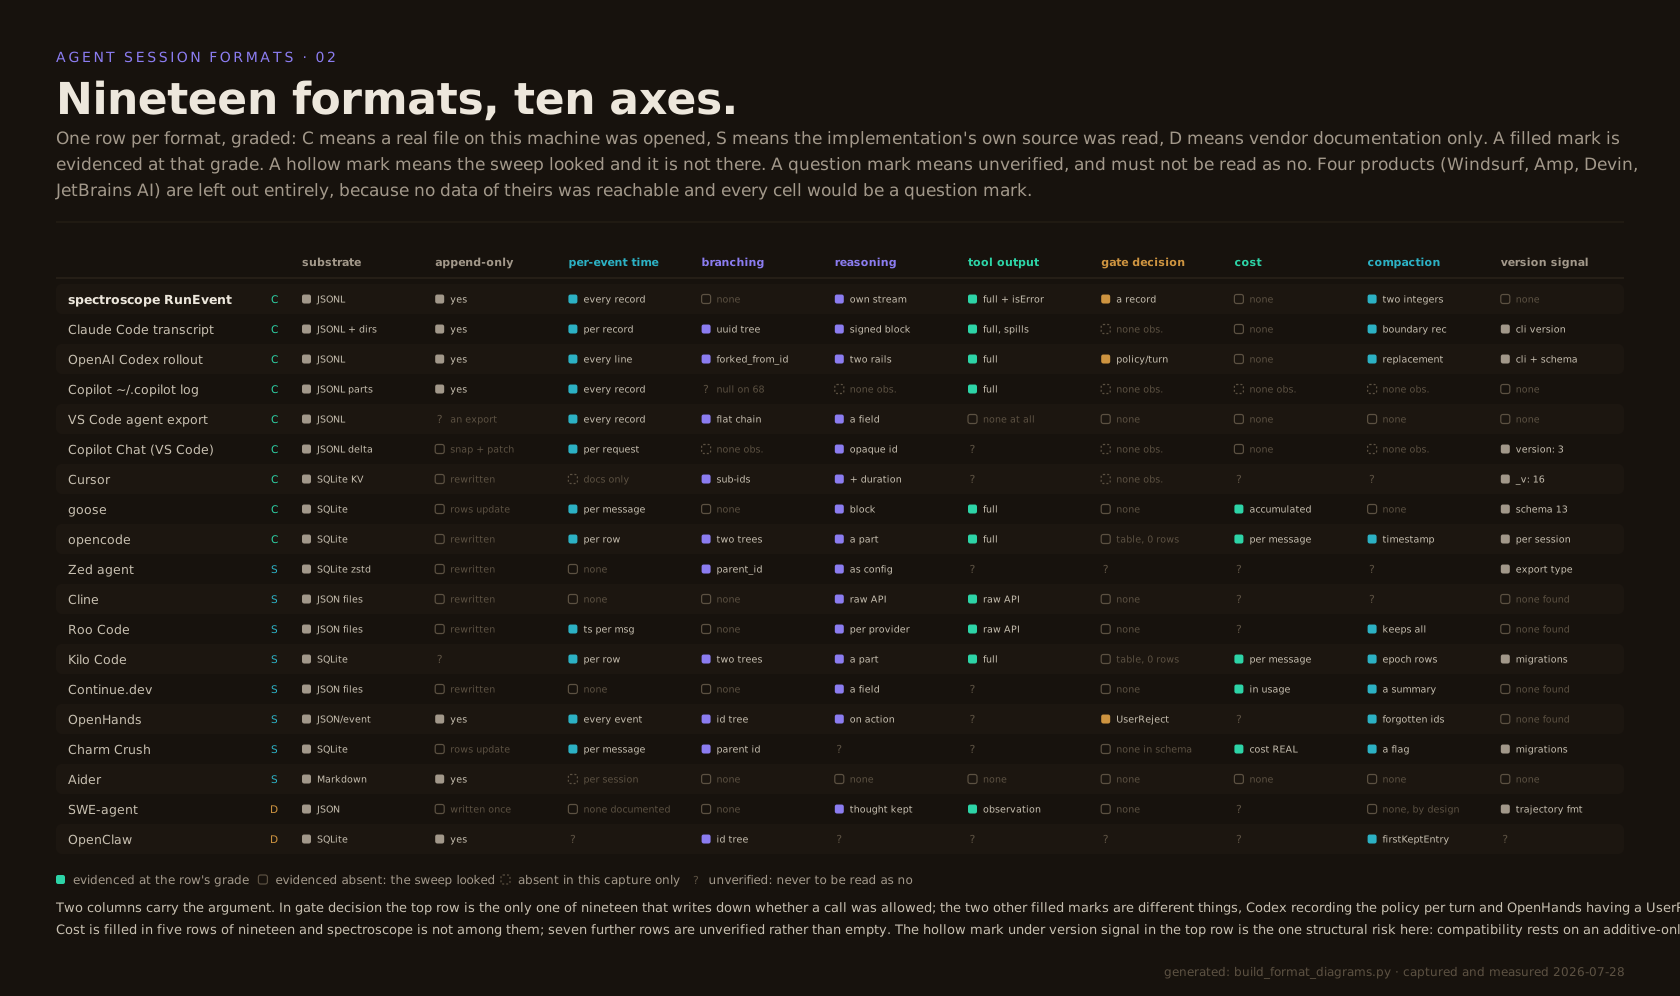
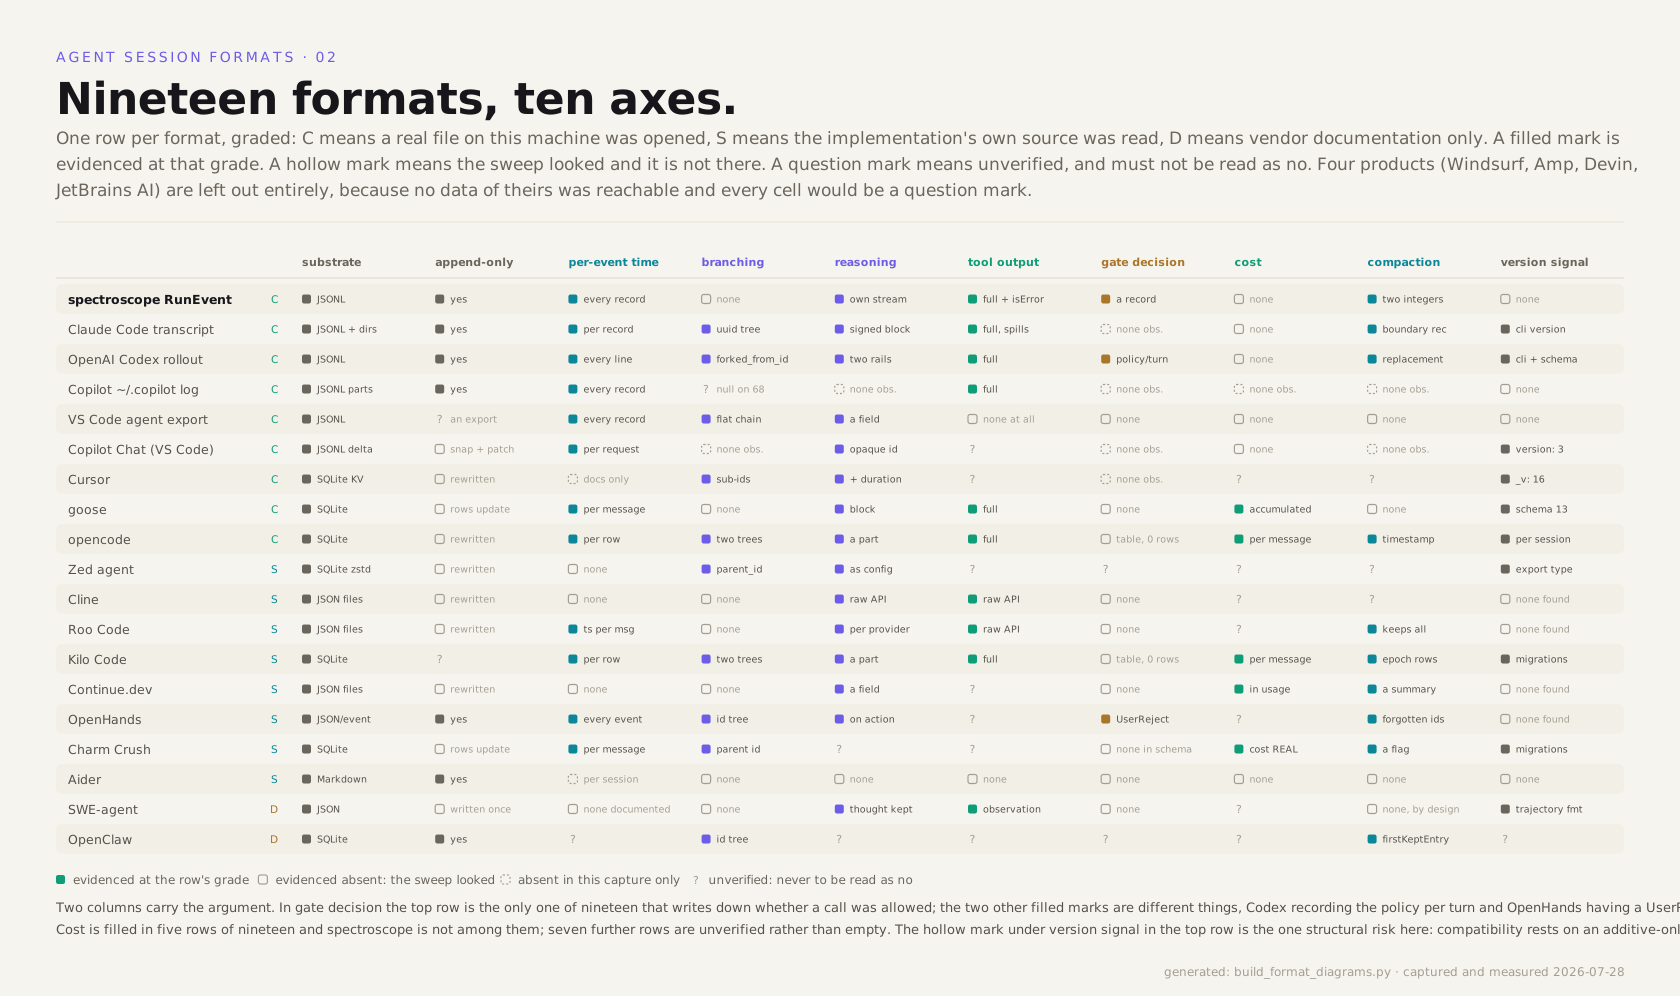
Four products are missing from the grid on purpose. Windsurf, Amp, Devin and JetBrains AI store nothing this survey could reach, so every cell would have been a question mark and an empty row reads too easily as an absence.
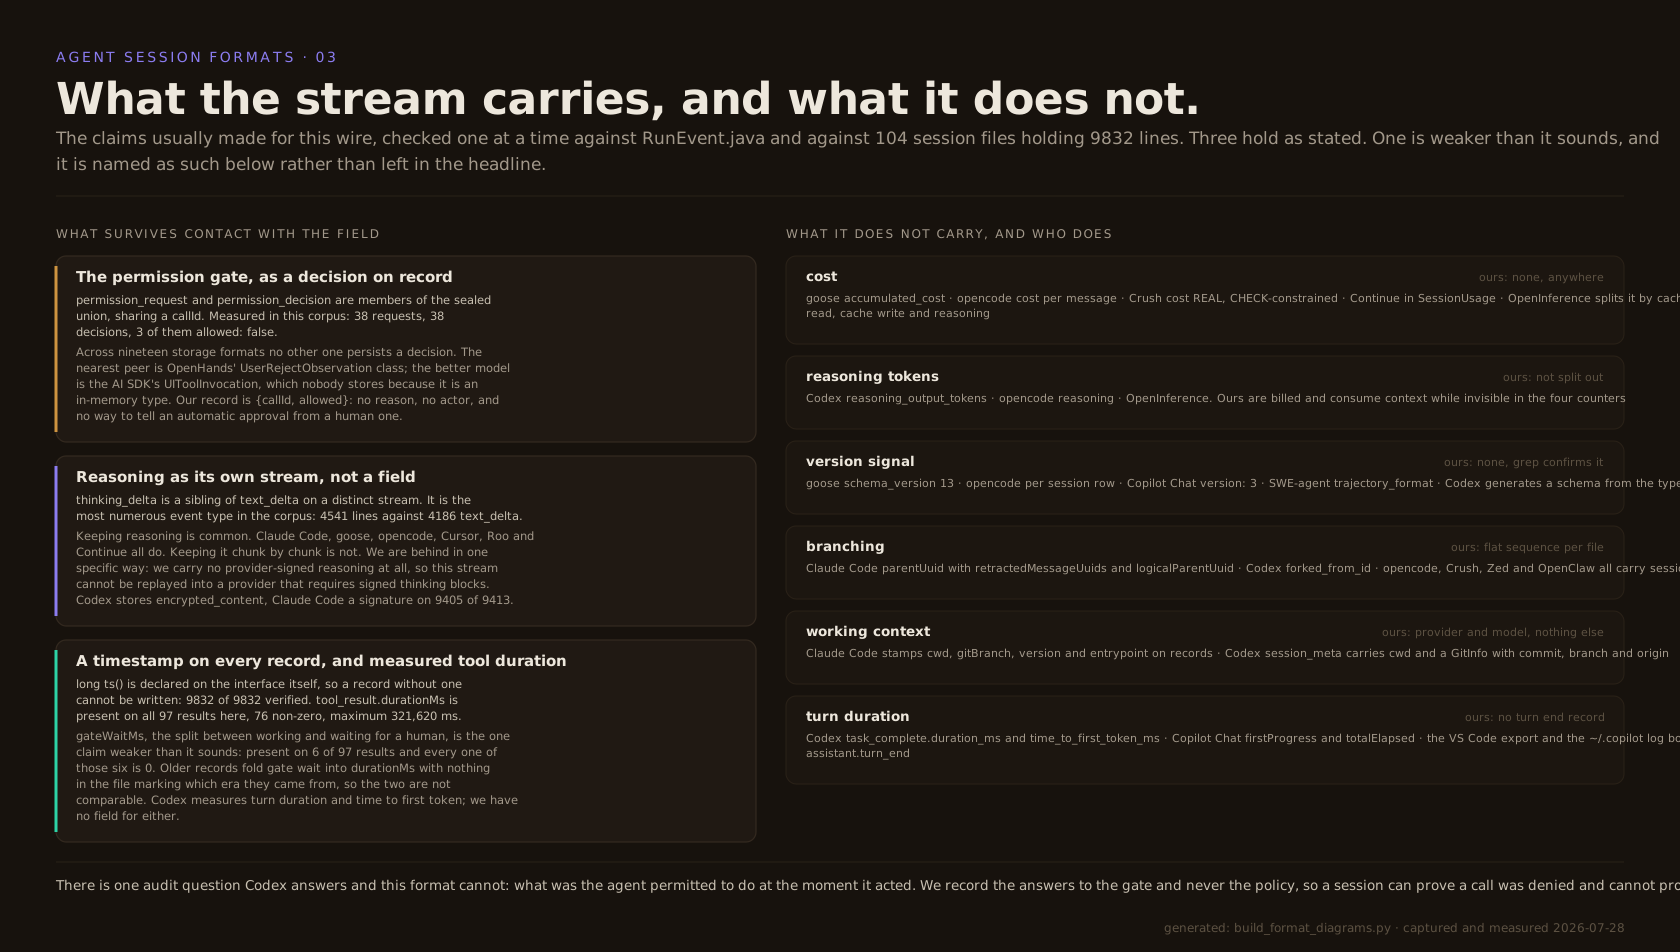
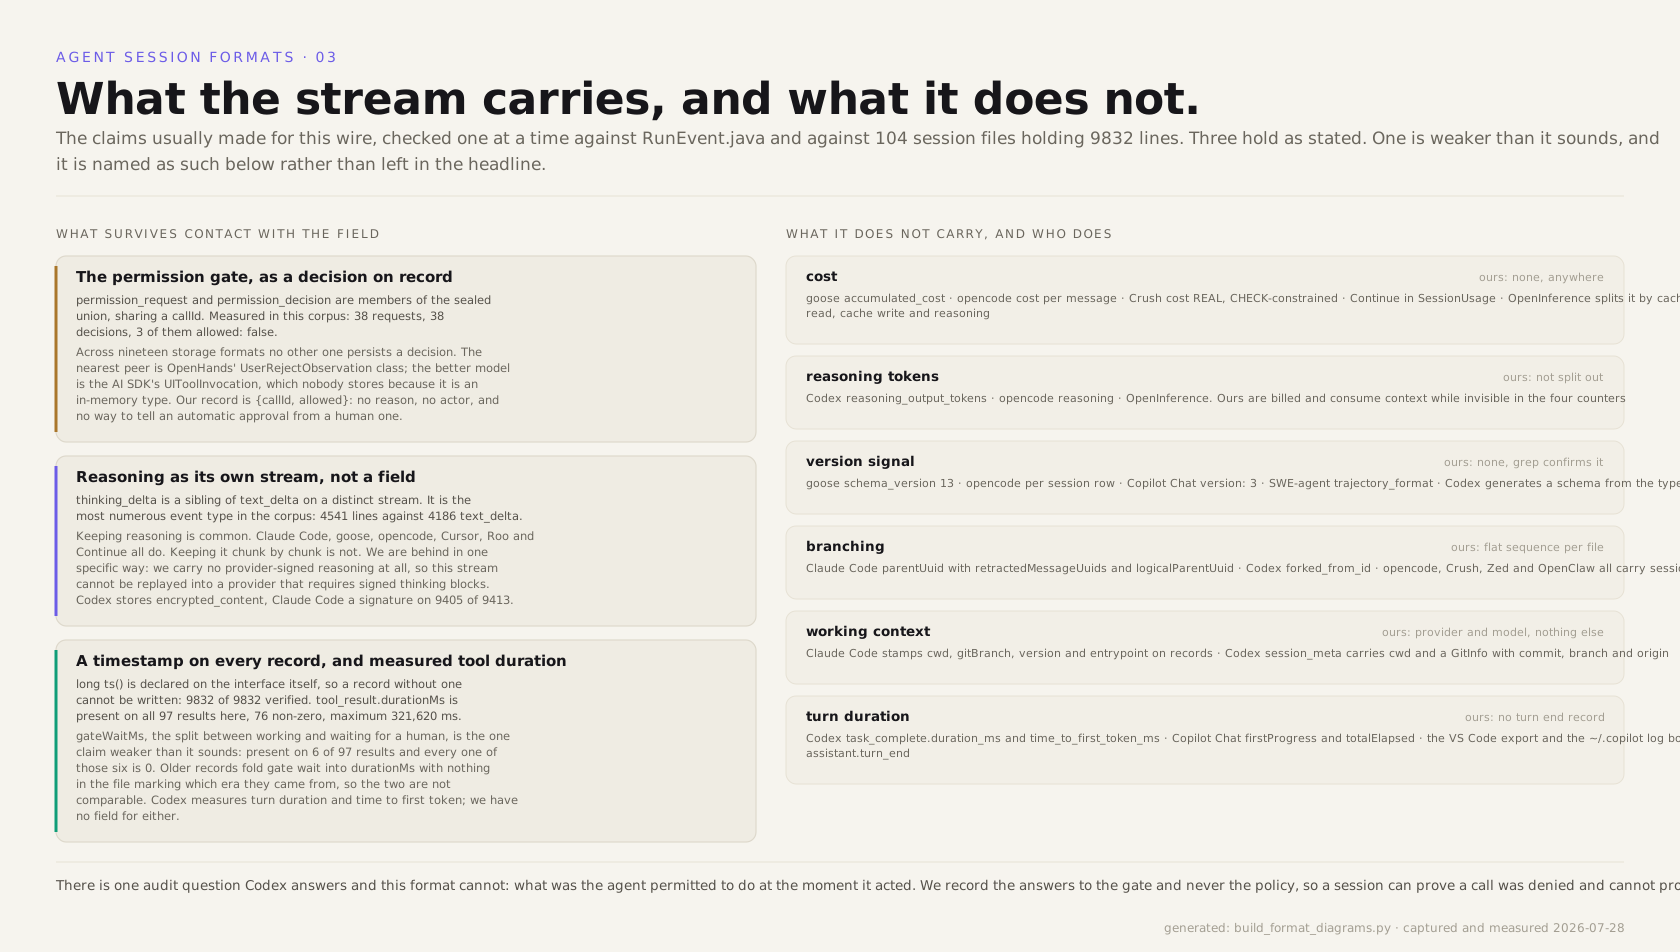
Three of the four claims usually made for this wire hold as measured. The
fourth, gateWaitMs, does not: it is present on 6 of 97 tool results in the corpus
and every one of those six is 0, so it is drawn as the weak claim it is rather than left in
the headline.
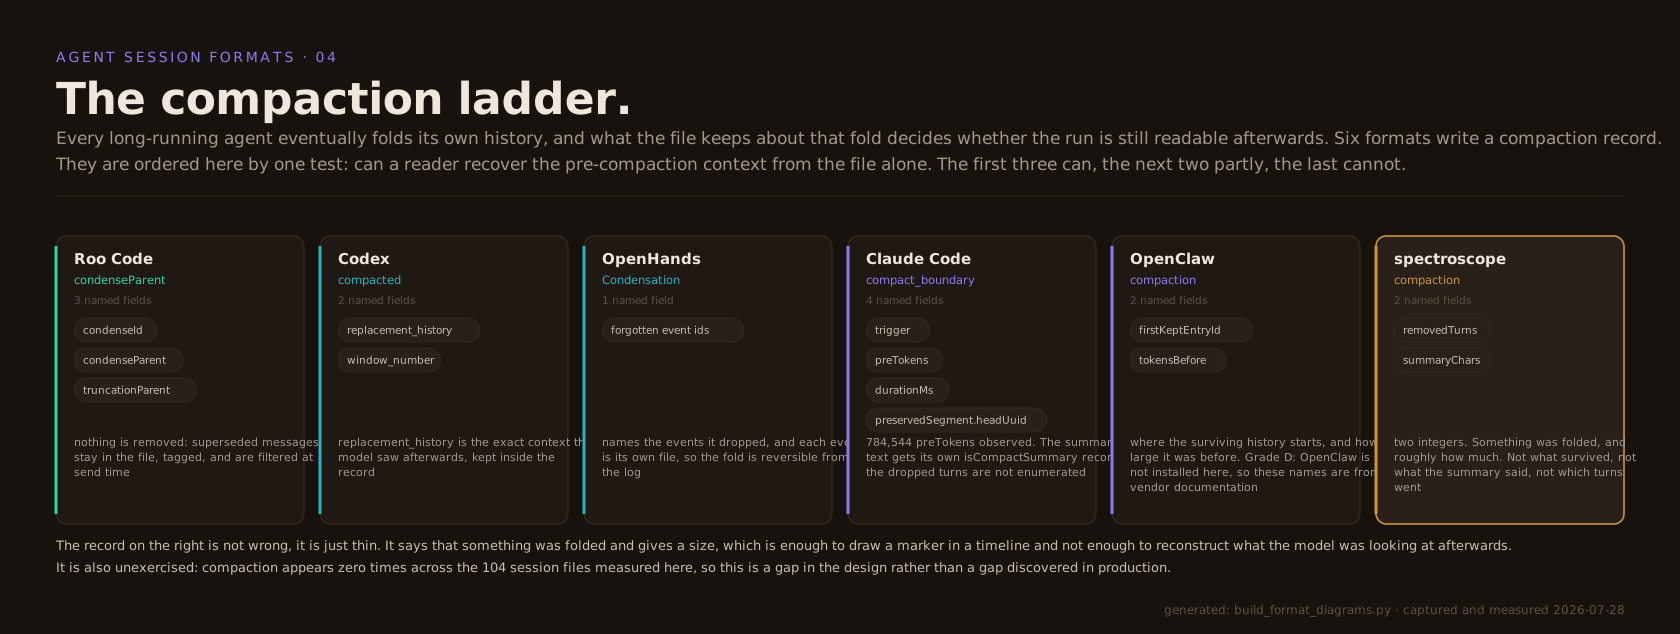
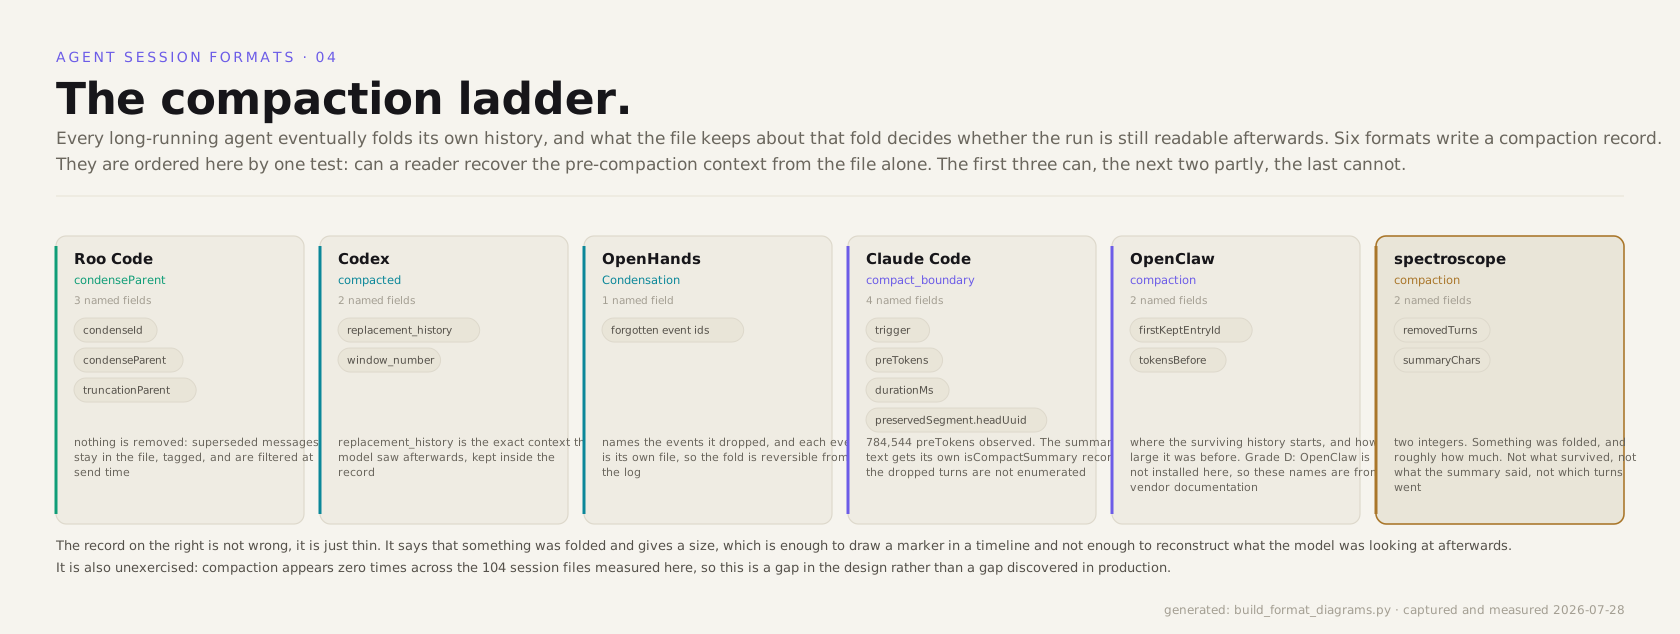
The place this format is furthest behind. A compaction record of
removedTurns and summaryChars is enough to draw a marker in a
timeline and not enough to reconstruct what the model saw afterwards.
what crosses the boundary today
Three formats in, three out, each with a round-trip test that reads the output back through the matching importer. The losses below are properties of the target format, not bugs: a shape that has no field for a permission decision cannot be made to carry one without inventing a field no other tool would understand.
| format | what survives | what does not | |
|---|---|---|---|
| read | spectroscope JSONL | everything: the file is replayed verbatim, with no adapter | nothing |
| read | Claude Code transcript | prose, thinking, tool calls and their full output, per-message model, token counts | tool duration, because the format records none. Gate events, which cannot exist there. Subagent records, which the current client writes into a sibling directory rather than into the transcript |
| read | VS Code agent export | prose, reasoningText, tool calls, turn boundaries |
all tool output, since the export records none: 149 of 149 results arrive with an empty string. Also all token accounting, the model and the provider |
| write | spectroscope JSONL | byte for byte, pinned against 8882 stored lines | nothing |
| write | Claude Code transcript | prose, reasoning, tool calls with full output, token counts, subagents as
Task tool uses |
permission requests and decisions, every duration, generated images, plans, inter-agent messages, errors and compaction records |
| write | VS Code agent export | prose, reasoning, tool calls, turn boundaries | tool output, subagent lanes, token counts, generated images, permission decisions, plans, inter-agent messages, errors and compaction records |
The controlling fact for export work: no storage format in this
survey can hold a spectroscope stream without loss, because none of them persists a permission
decision. It is the same gap the project's own OTLP bridge hit, which is why it has to
send spectroscope.gate.allowed as a custom attribute. Two of the three things this
format is best at have no standard attribute anywhere.
The survey is reproducible: the diagrams come from
tools/build_format_diagrams.py, which refuses to emit text wider than its box, and
every count in them was measured against 104 local session files holding 9832 records. The
record definition itself is
RunEvent.java.
architecture
one core, every wire.
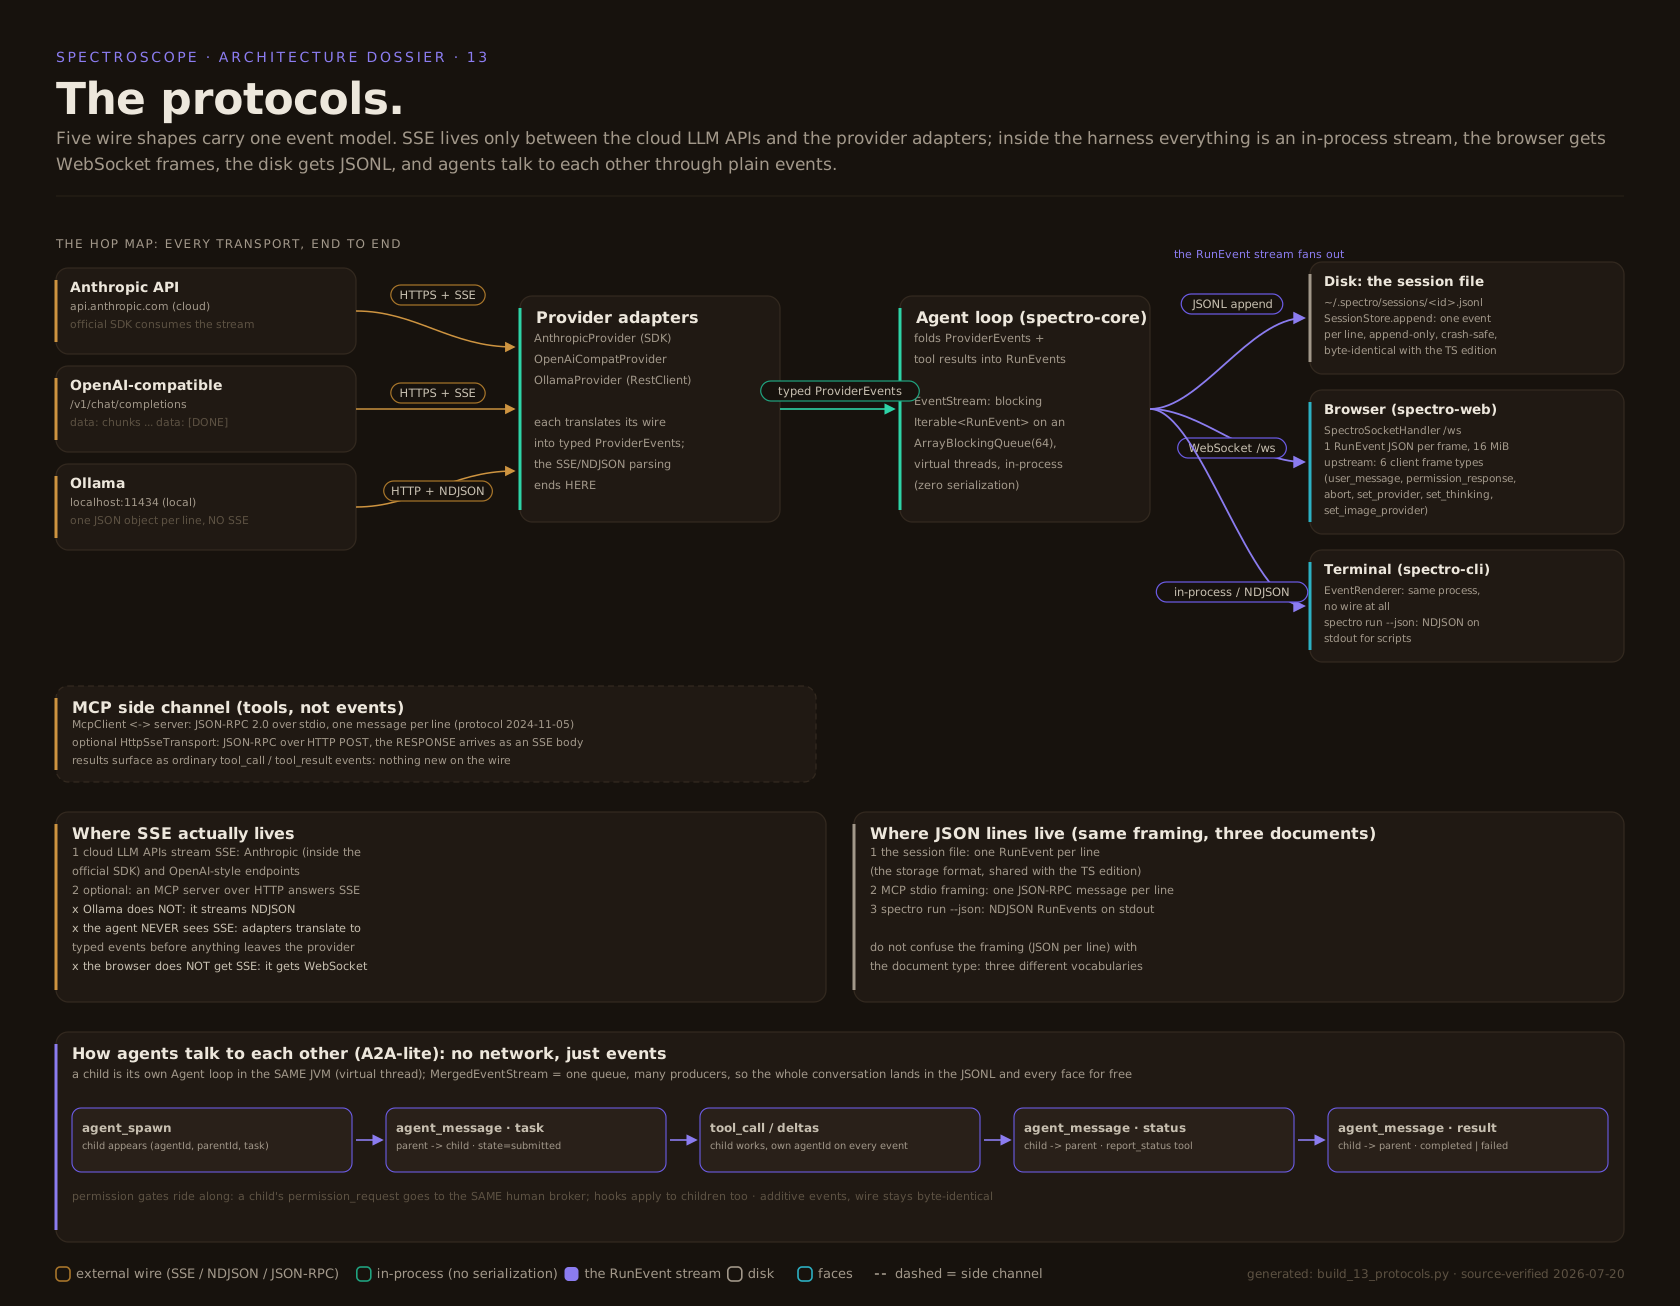
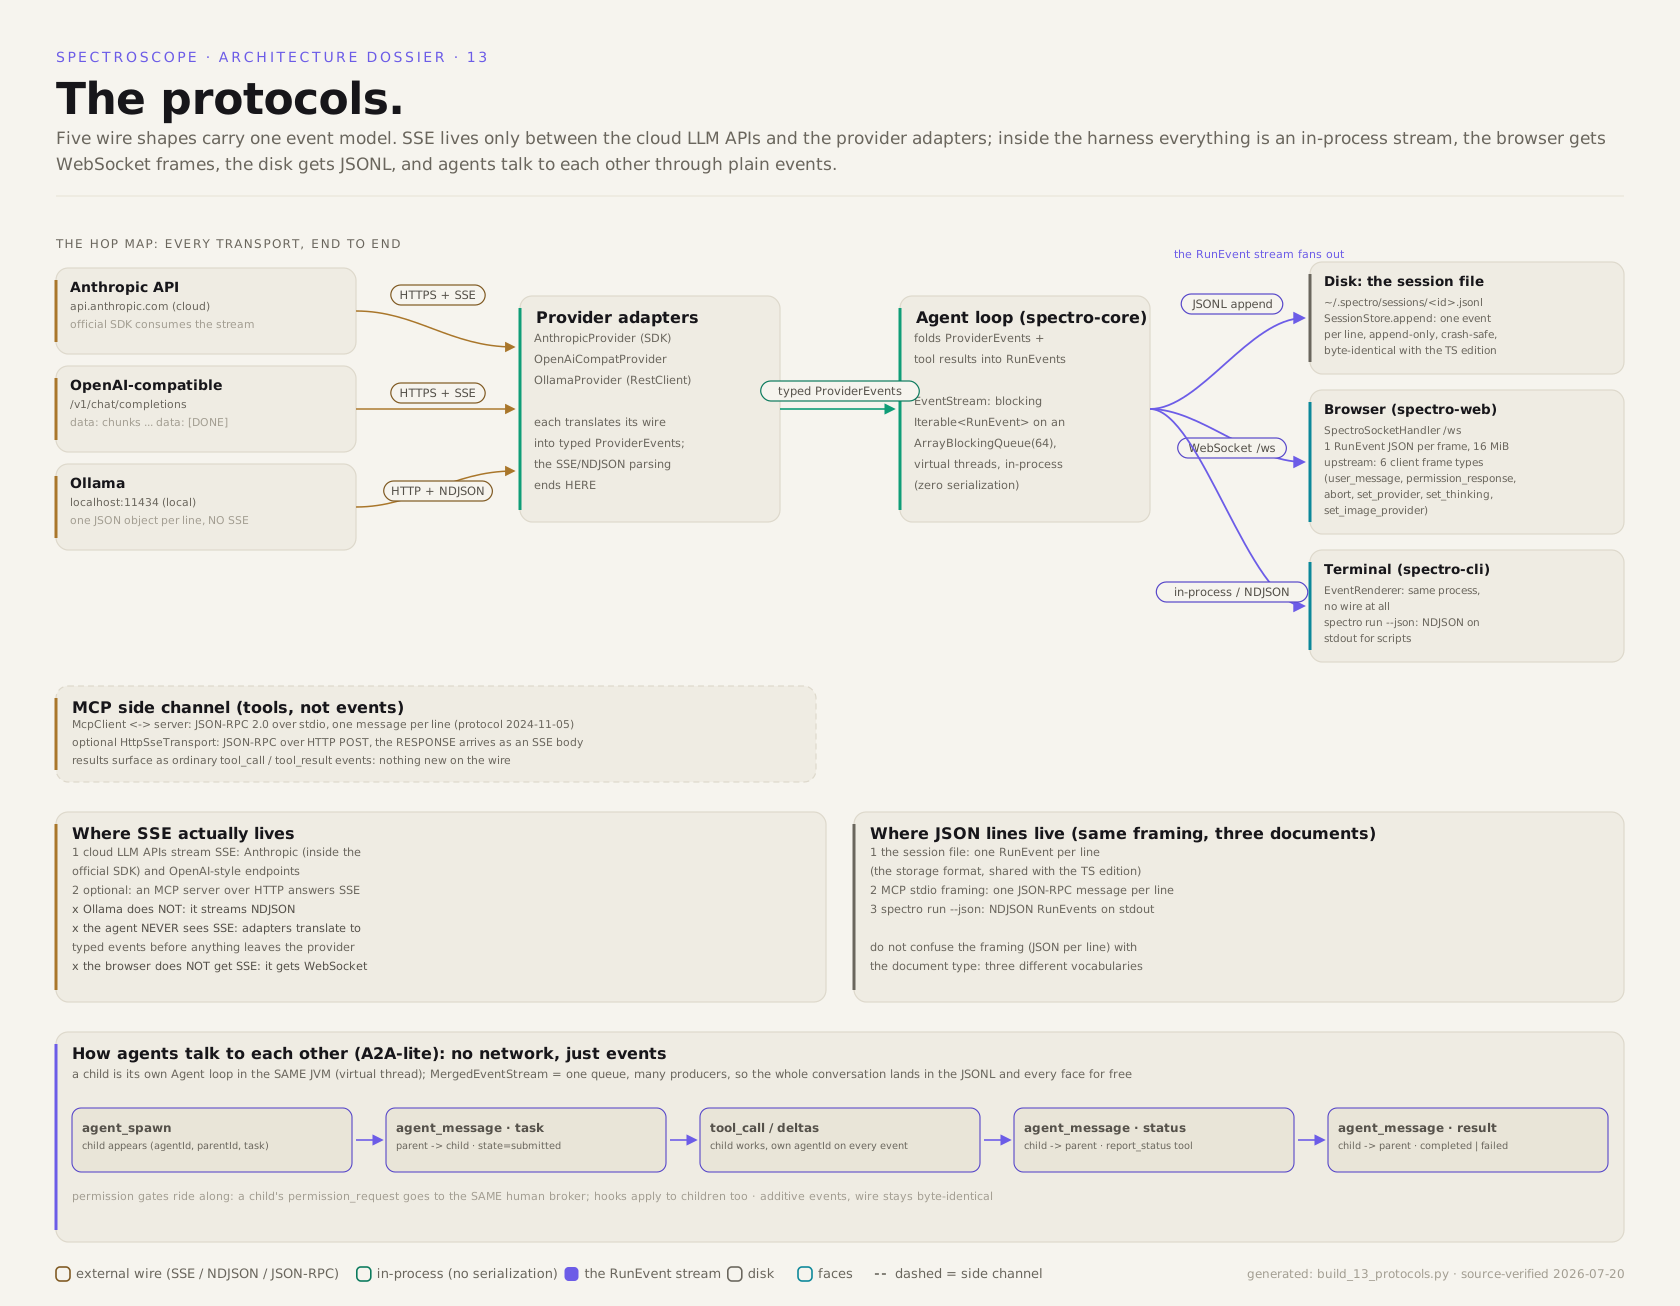
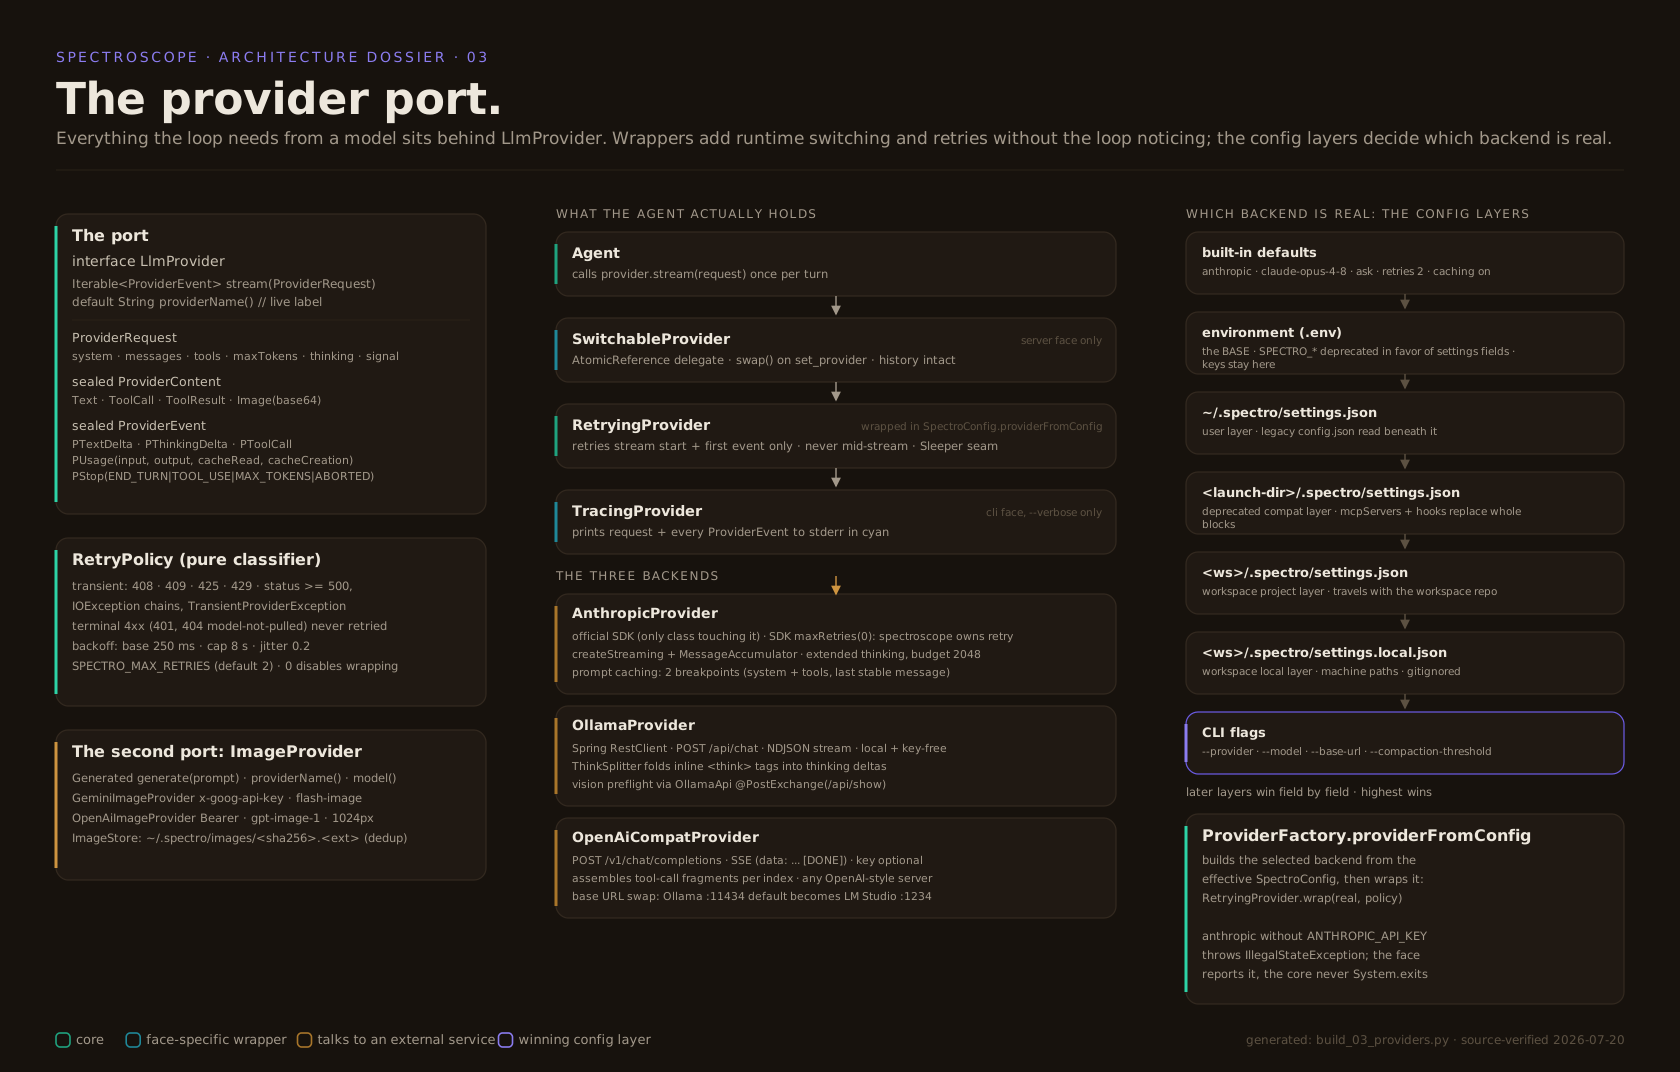
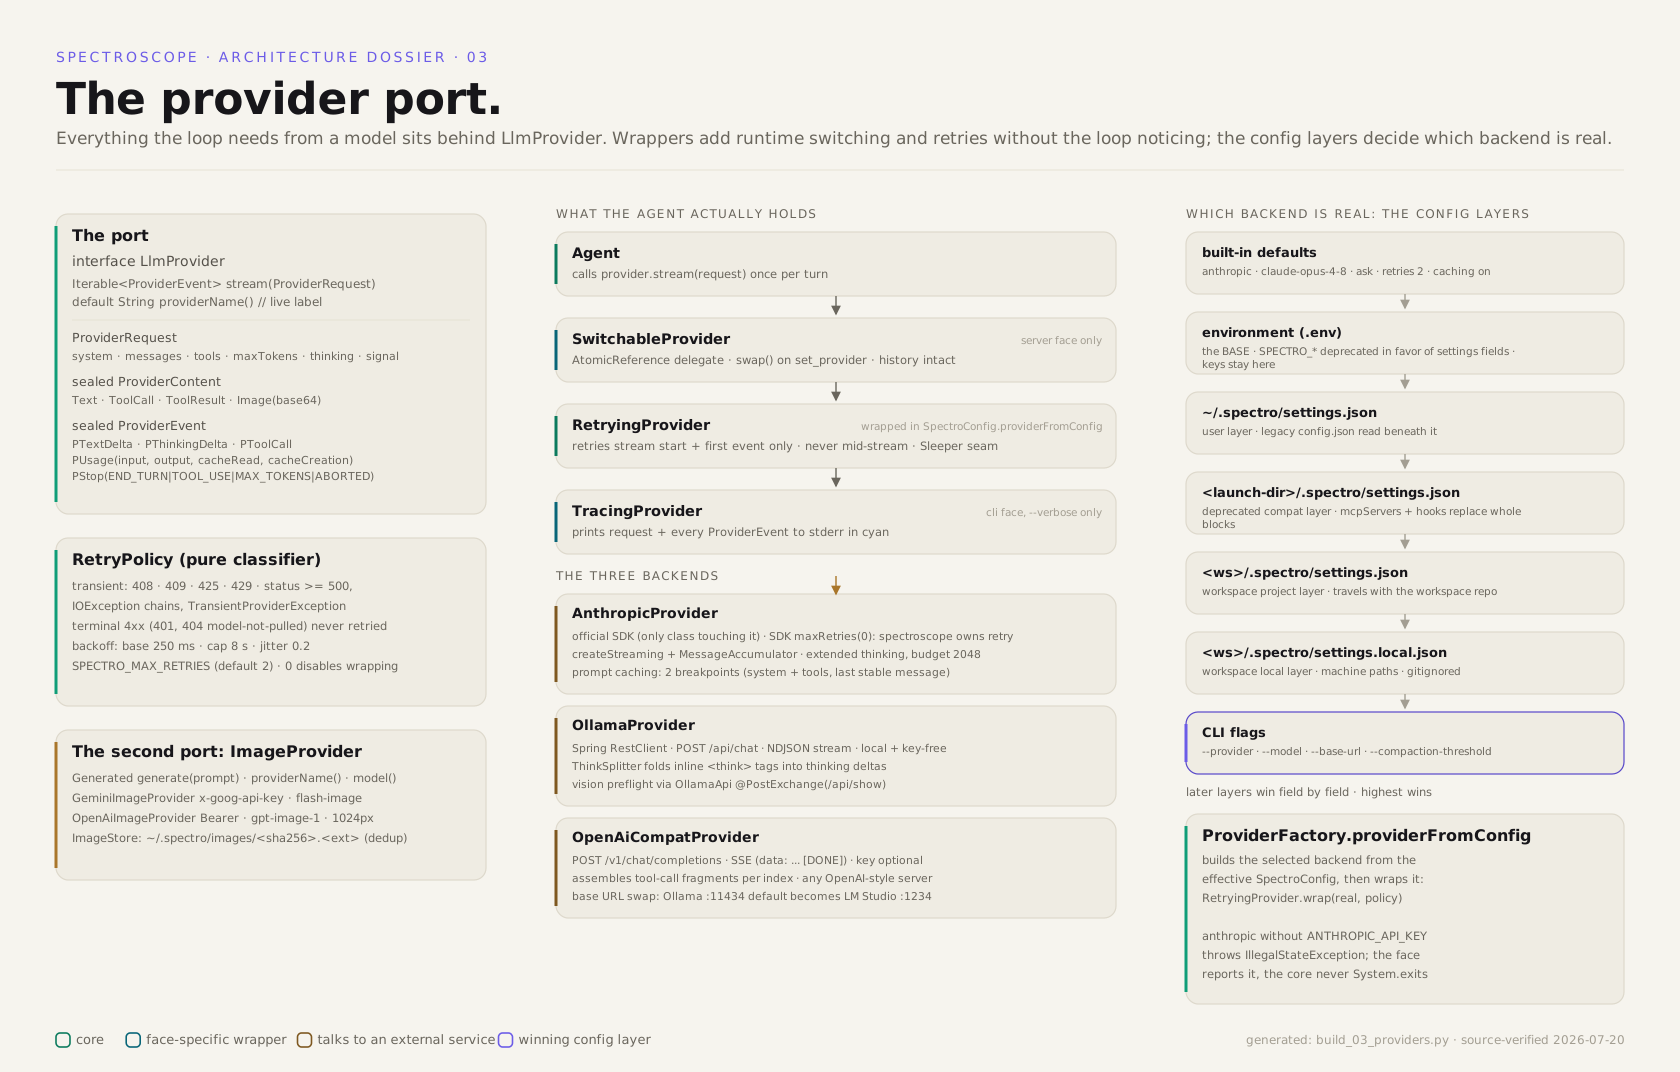
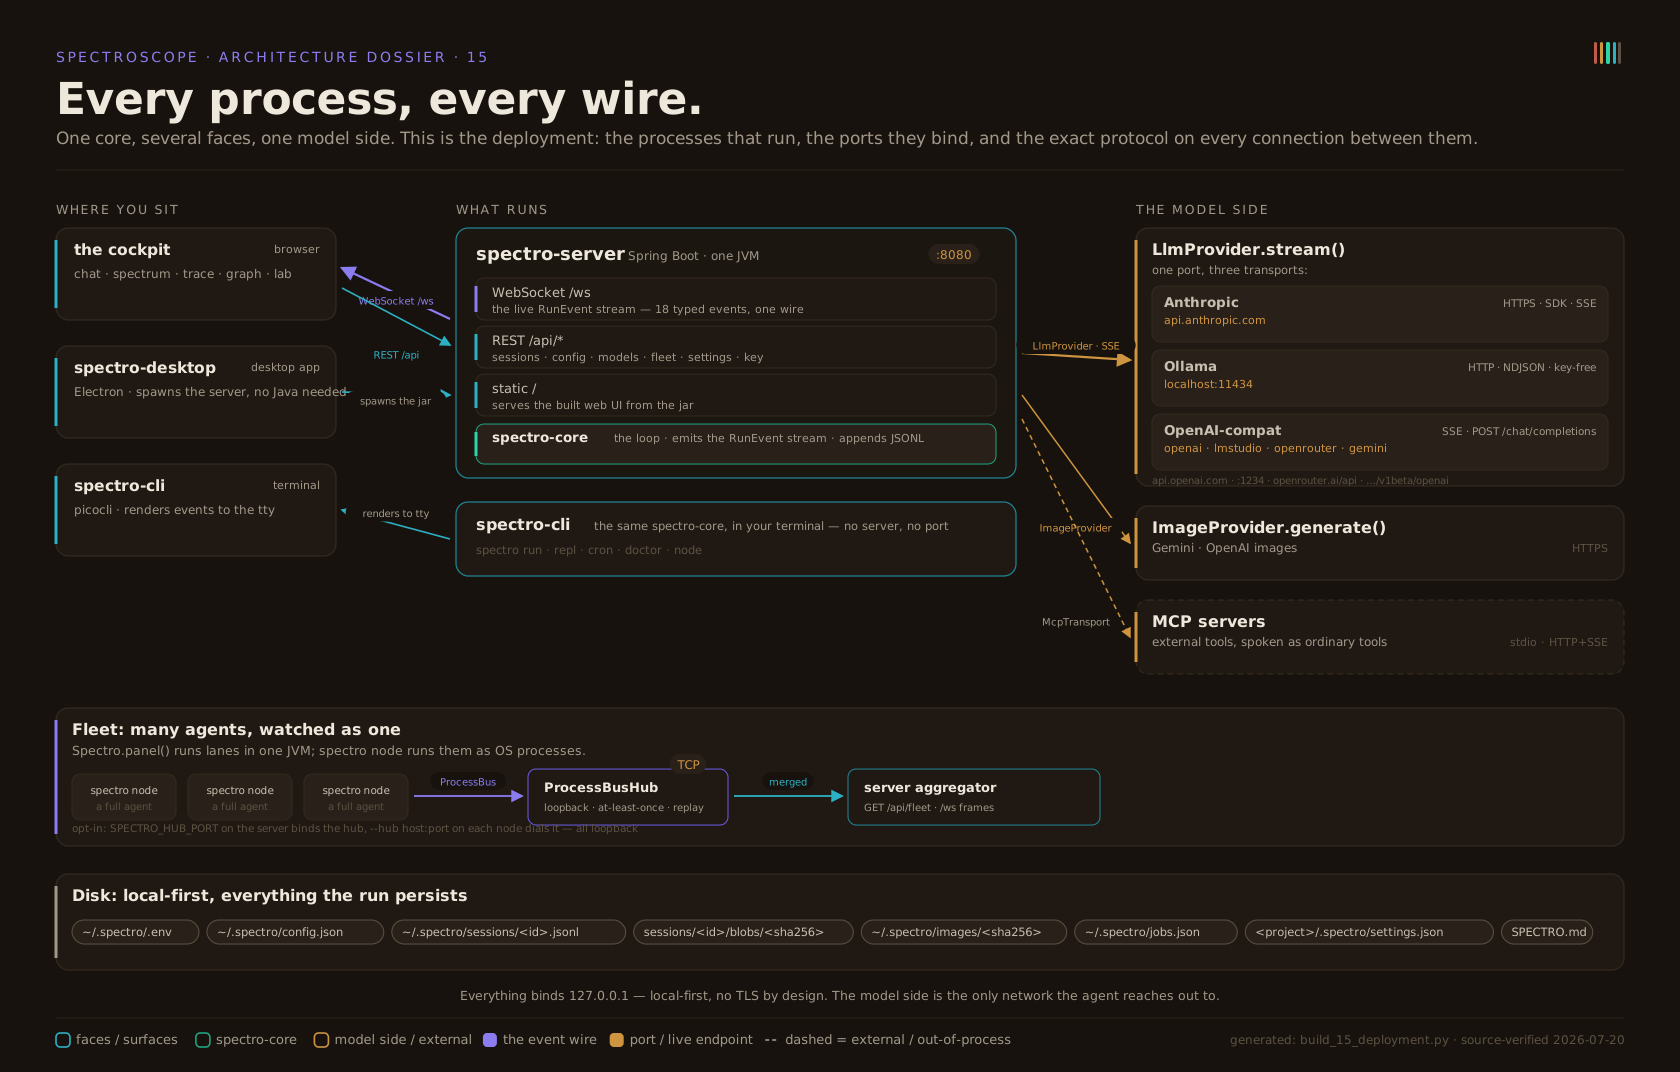
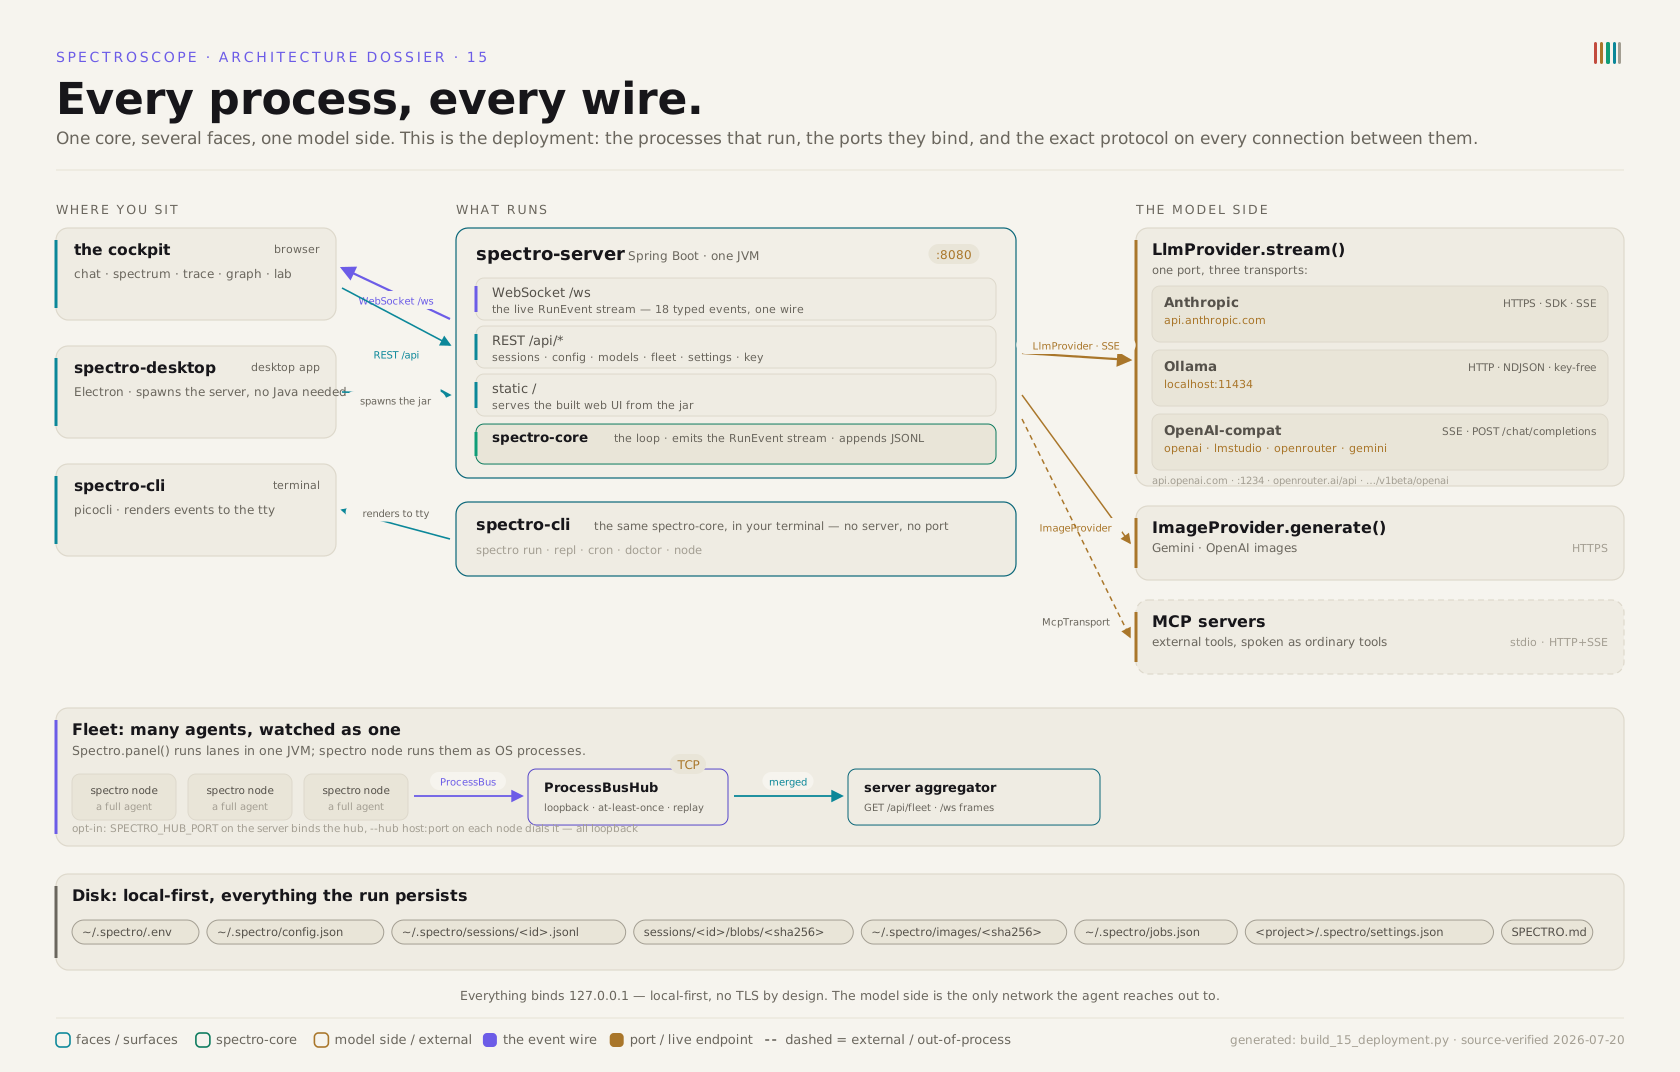
The deployment, source-verified: the processes that run, the ports they bind, and the exact
protocol on every connection between them — WebSocket and REST to the browser, SSE, HTTPS
and NDJSON to the model side, stdio and HTTP to MCP, TCP between fleet nodes and the hub.
Everything binds 127.0.0.1: local-first, no TLS by design, and the model side is the
only network the agent reaches out to.
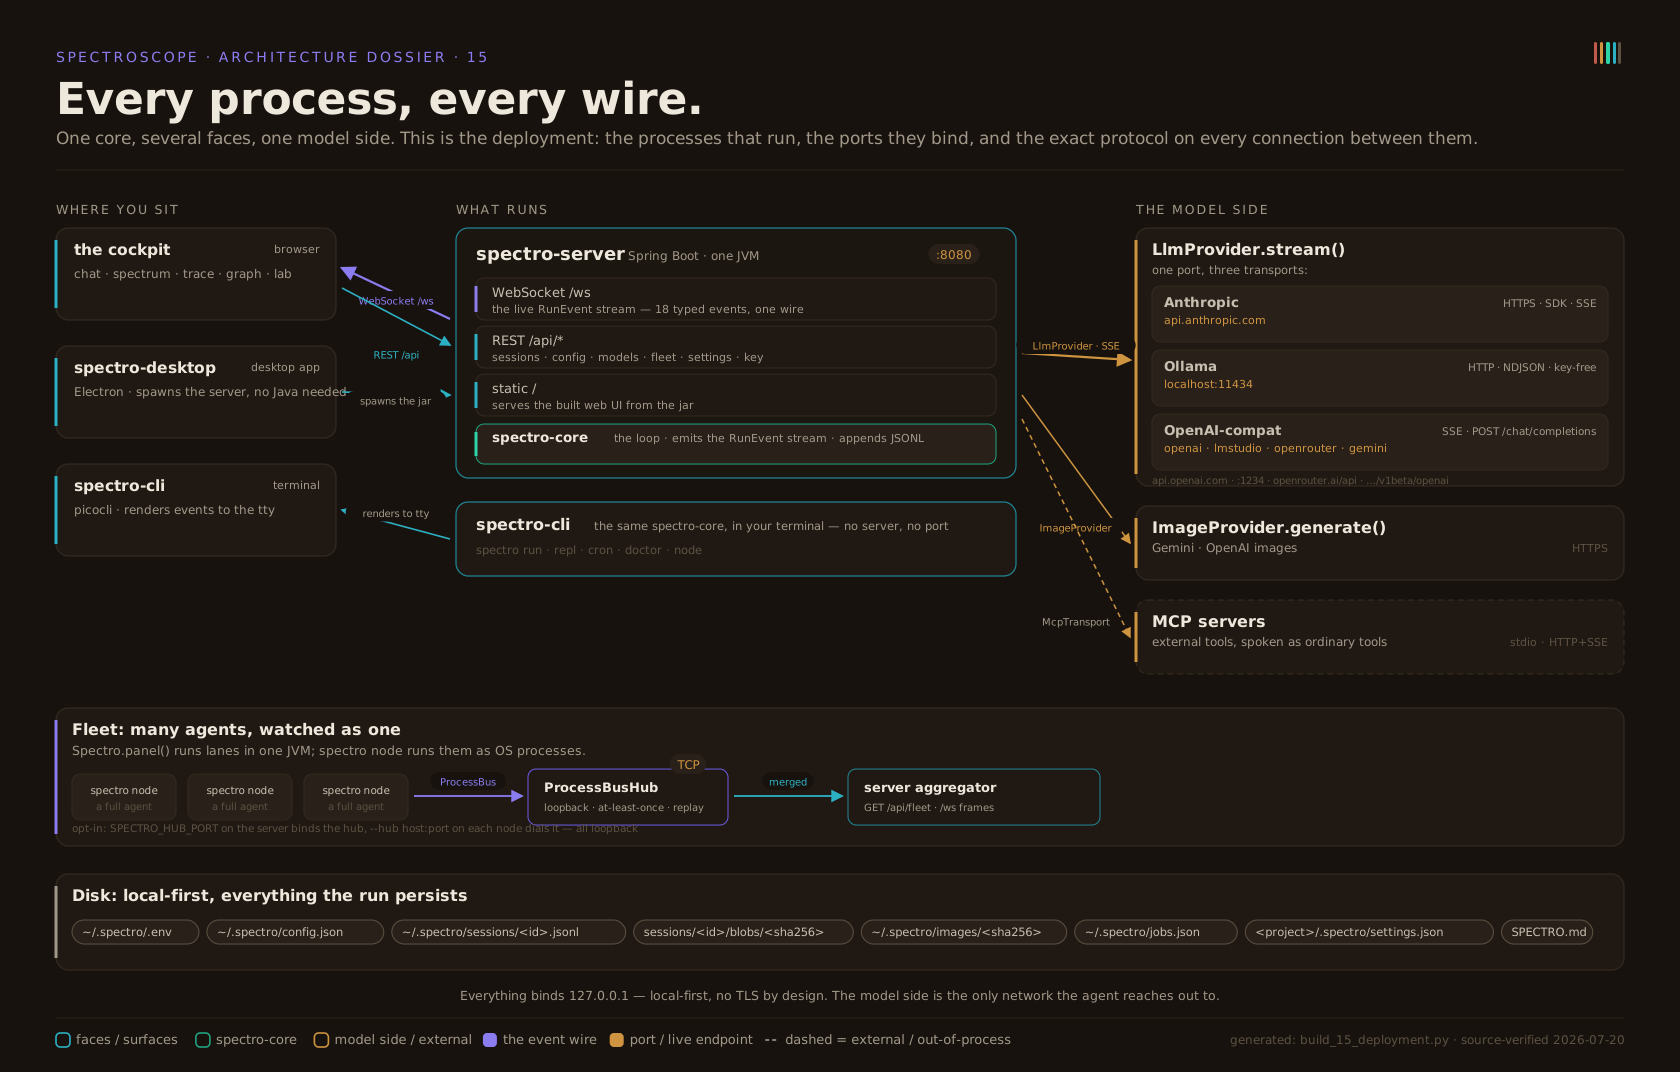
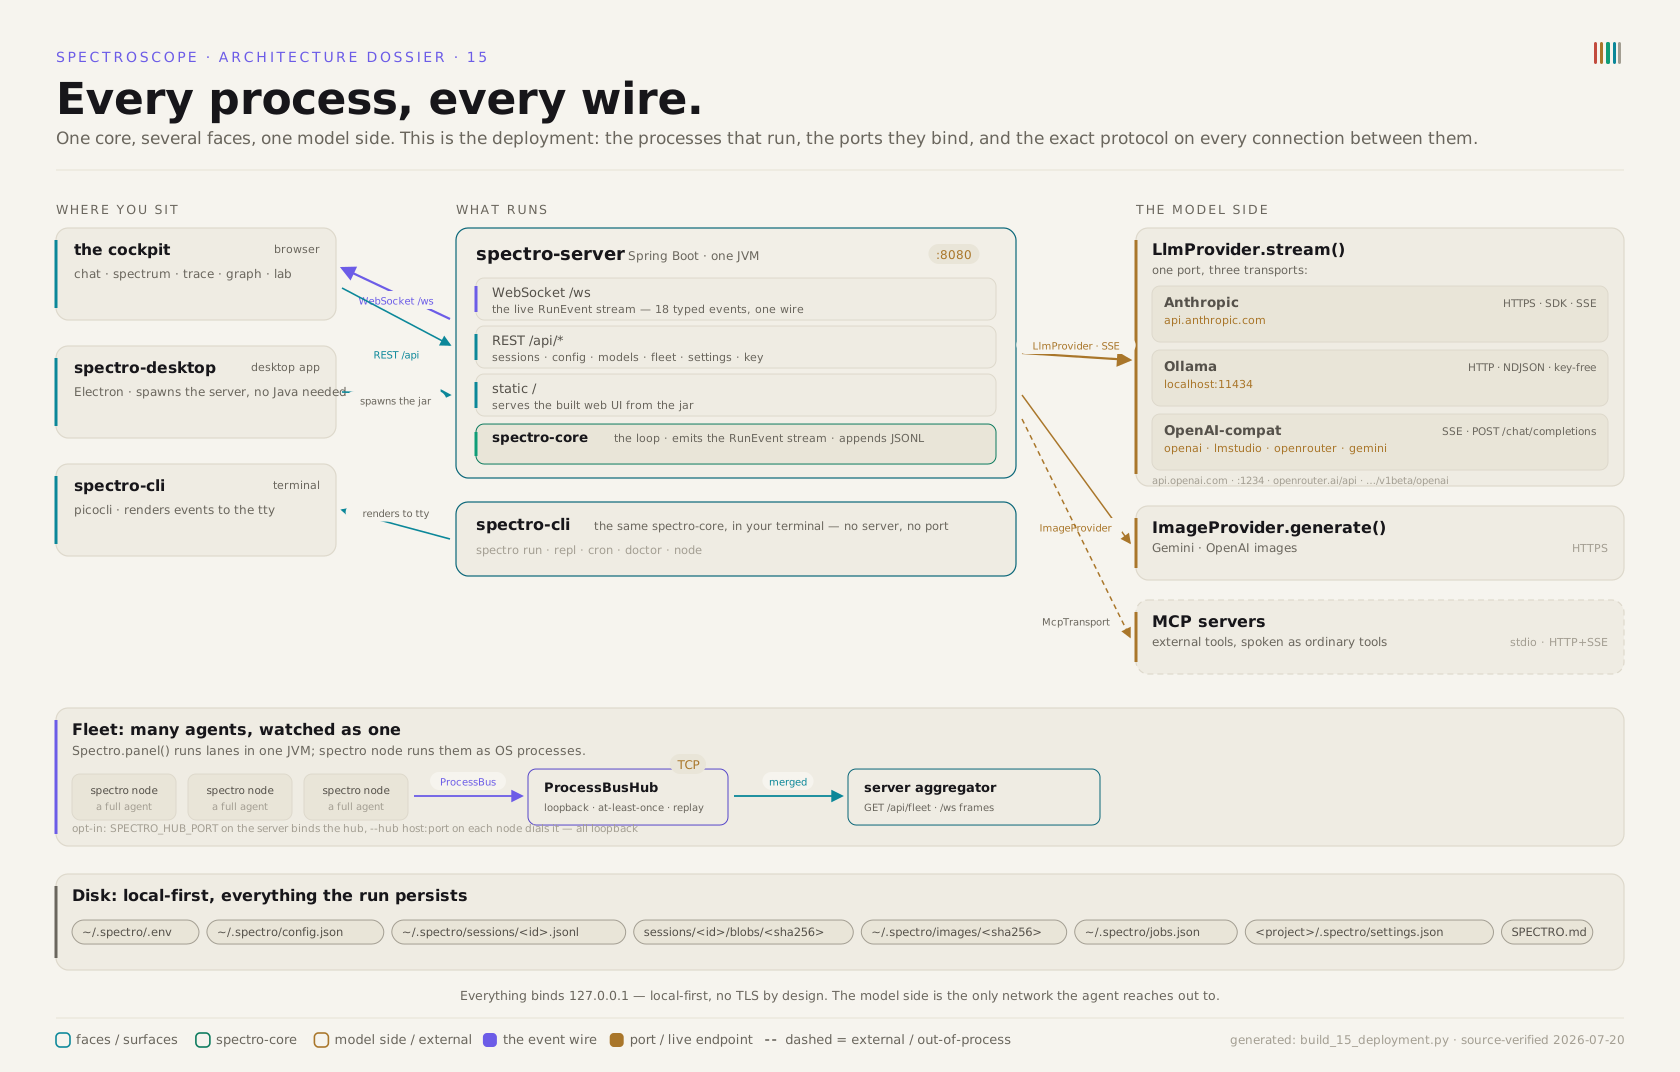
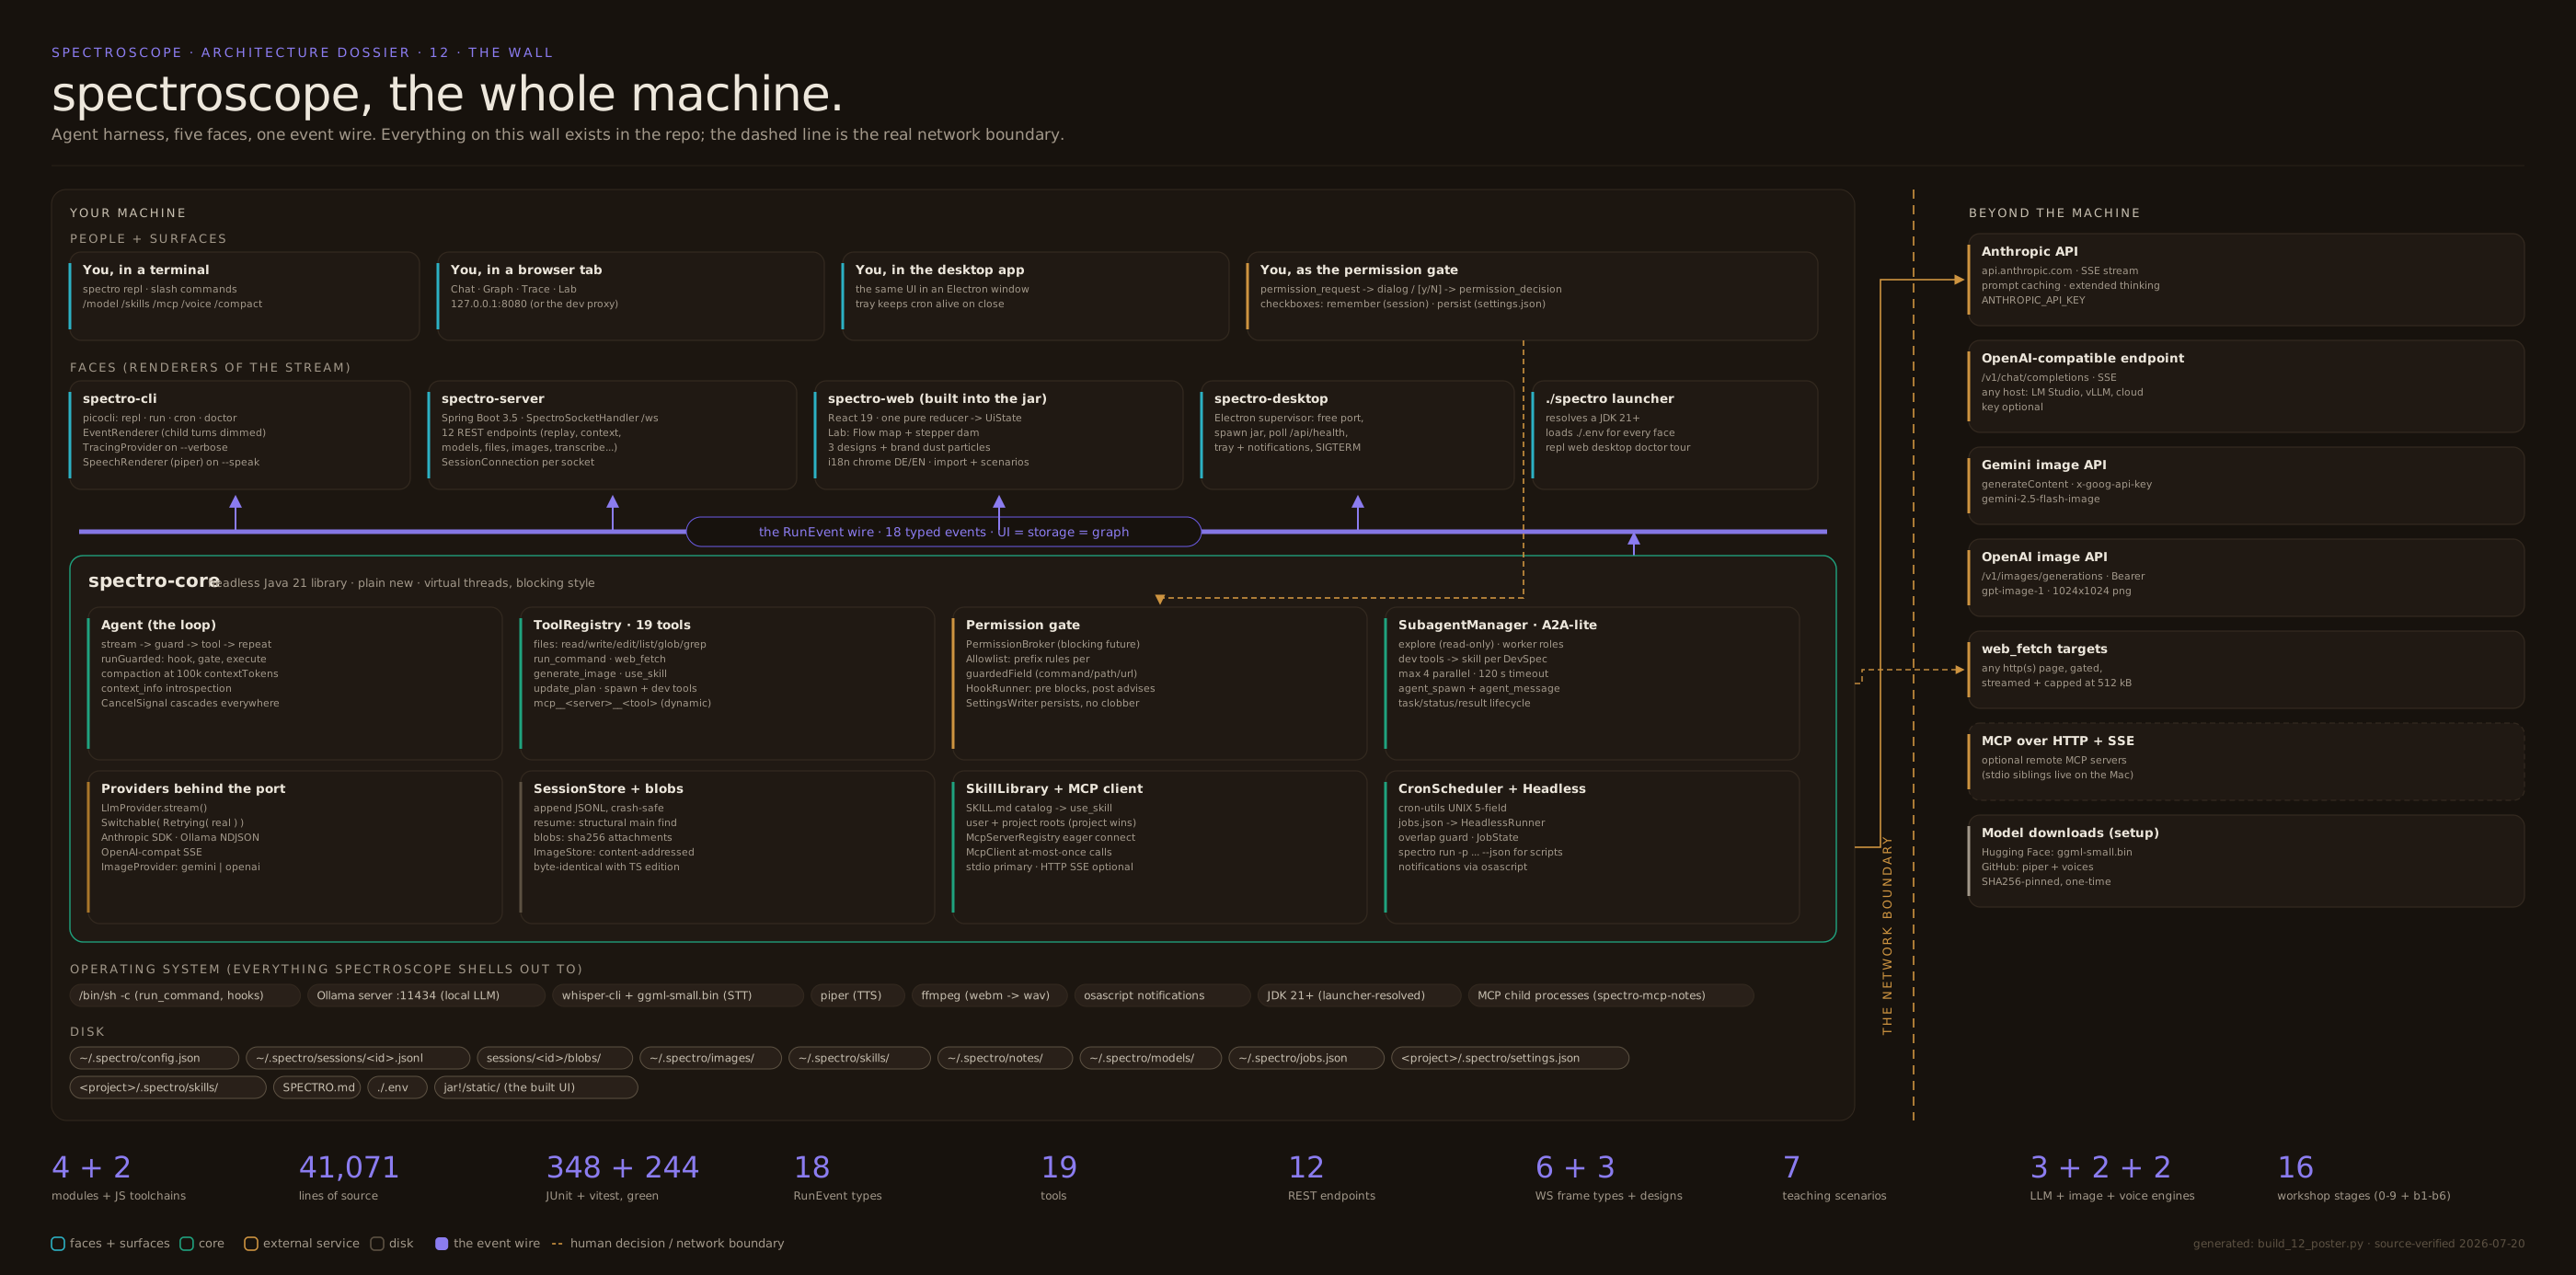
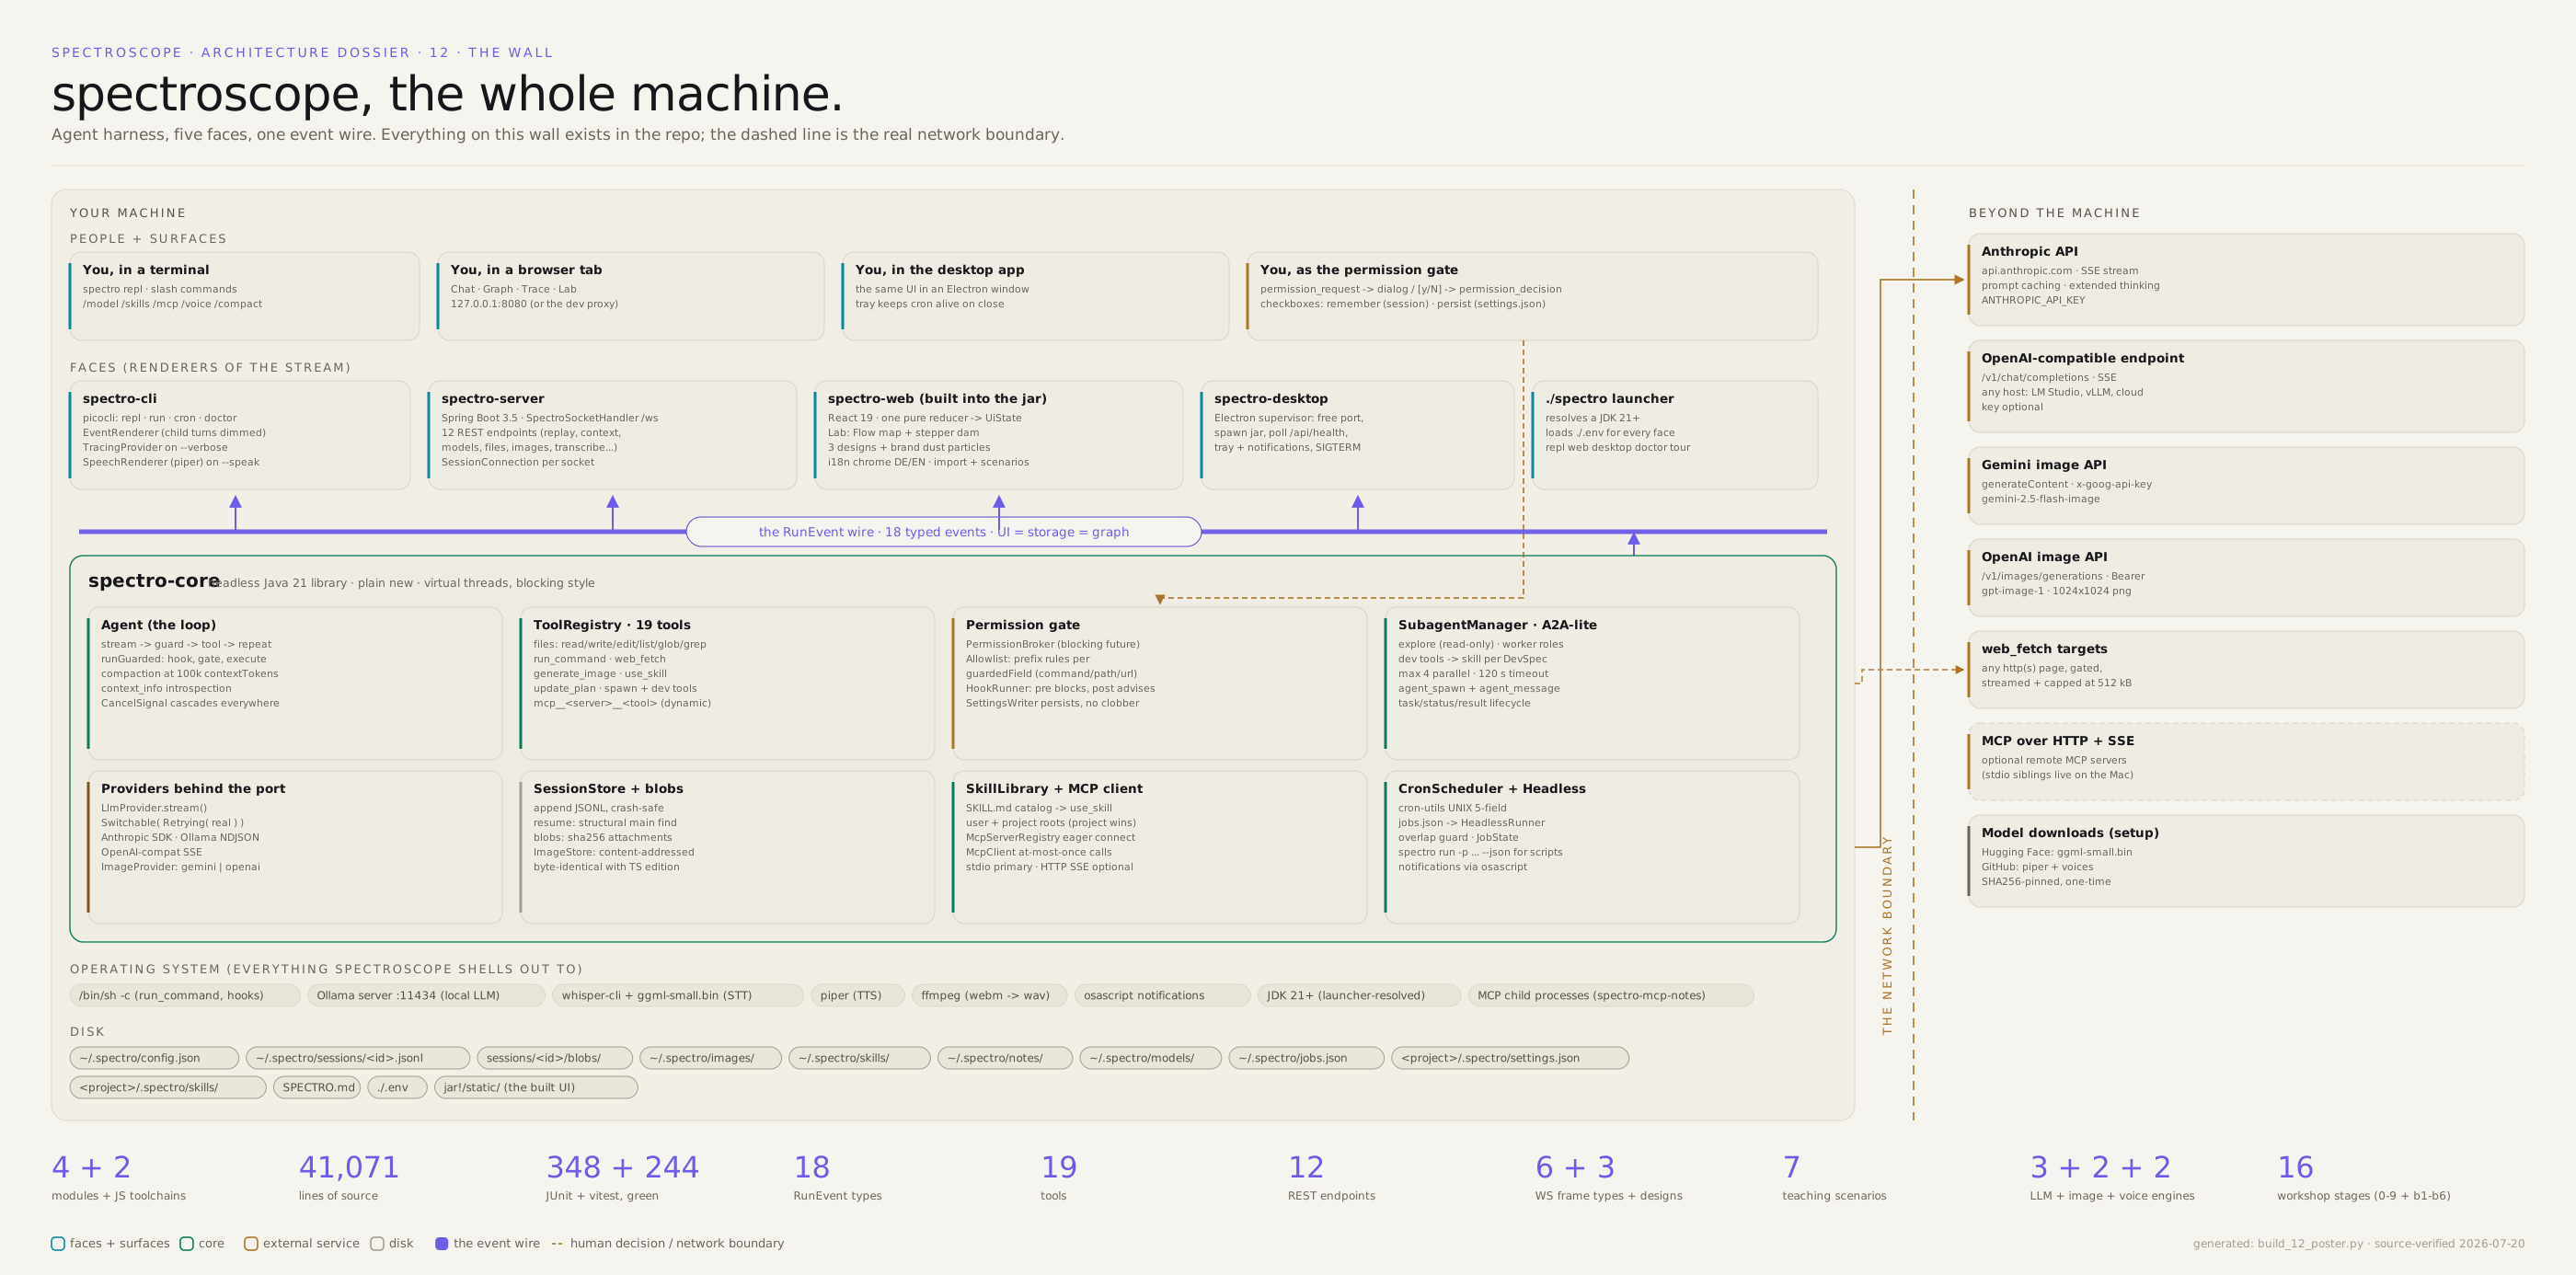
One level up — the big picture: one headless core, five faces, one event wire.
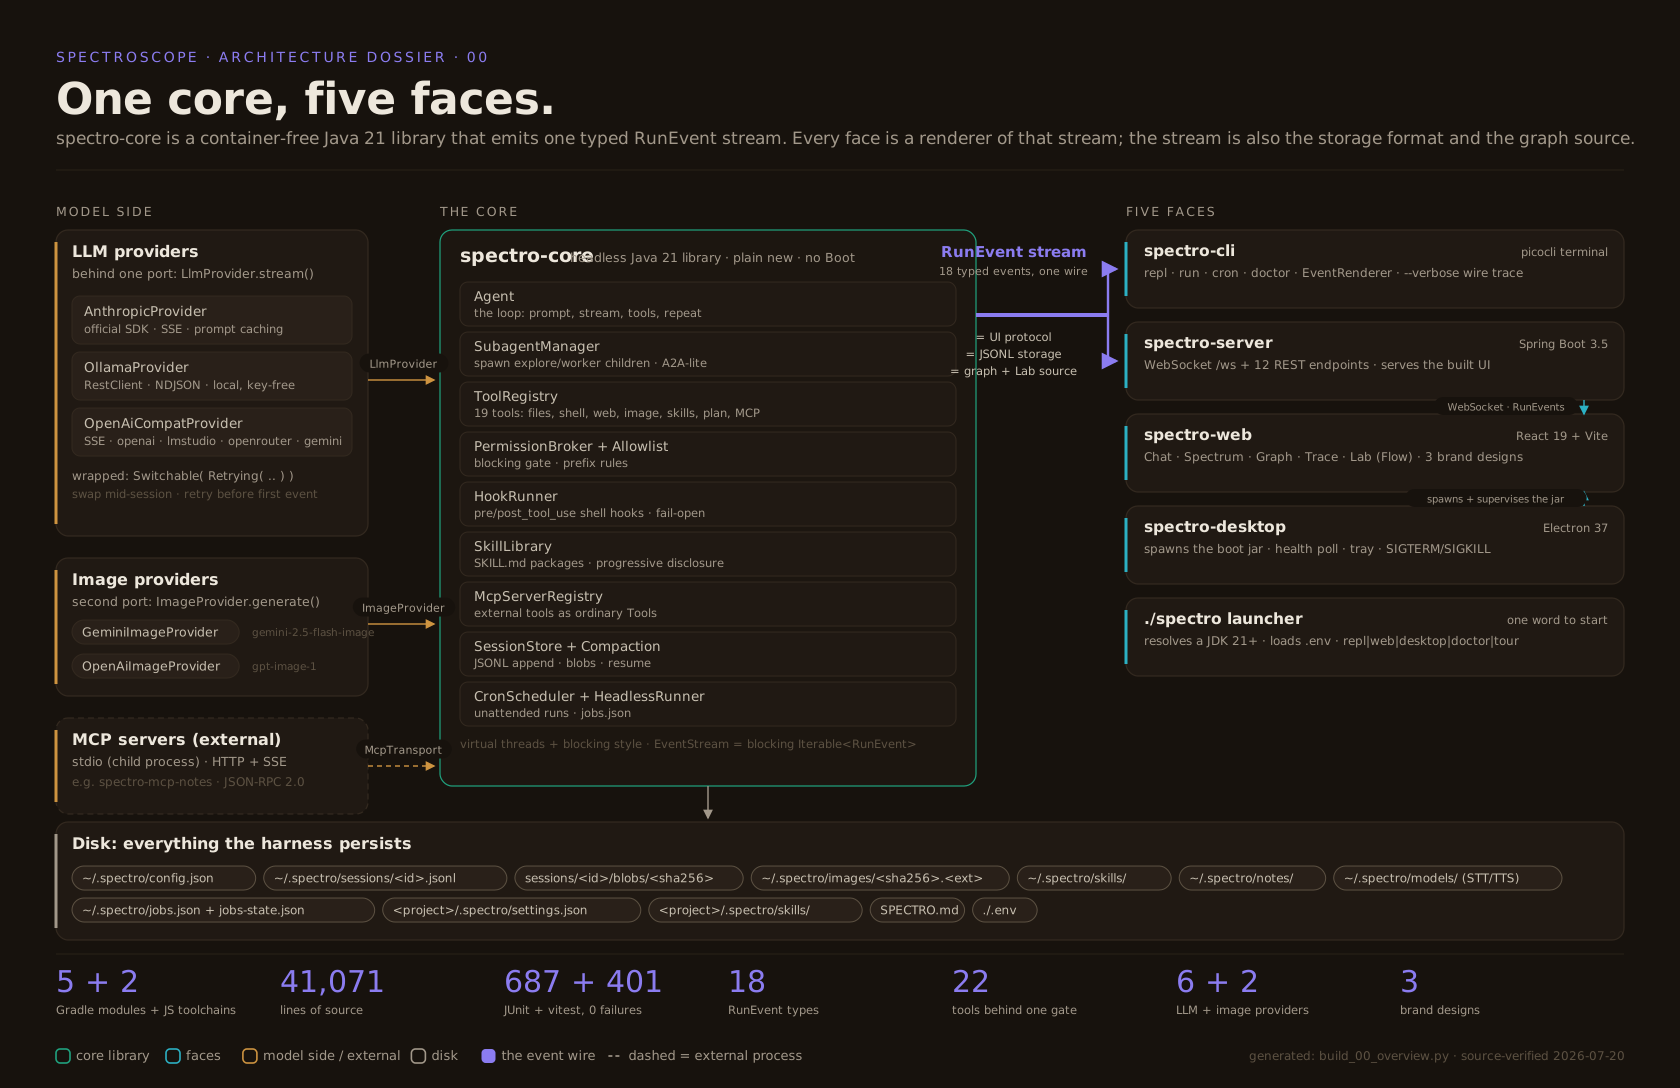
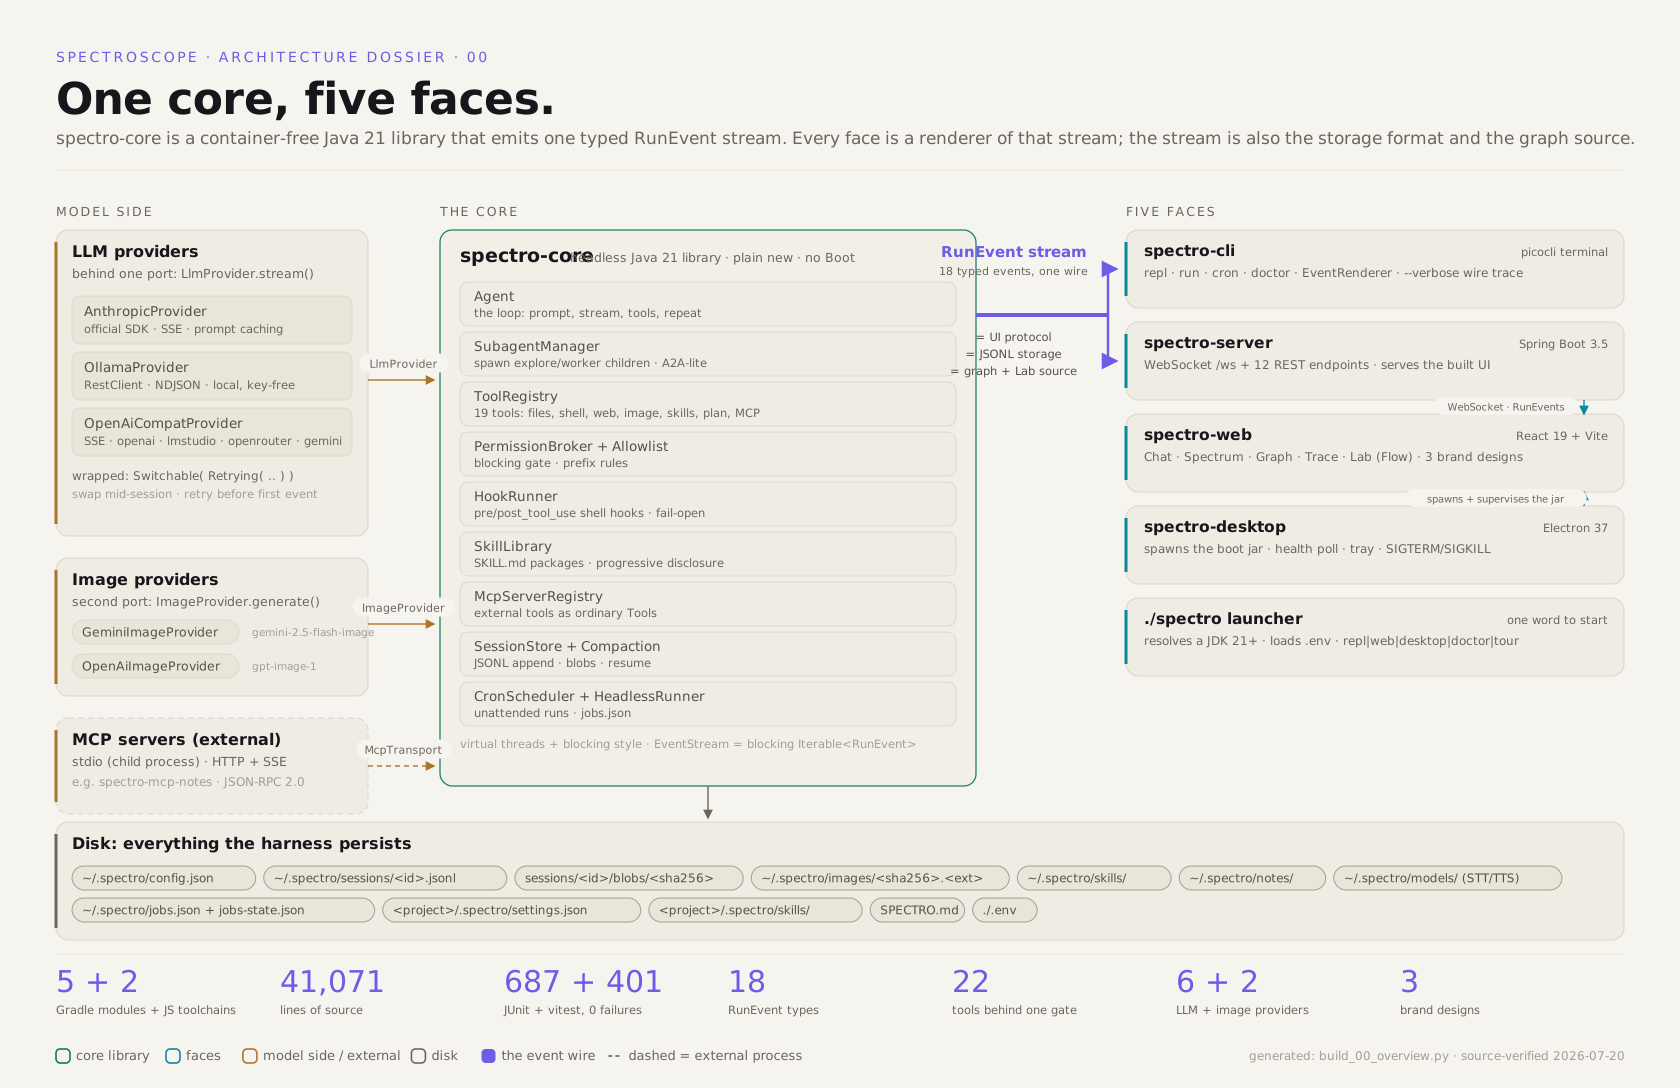
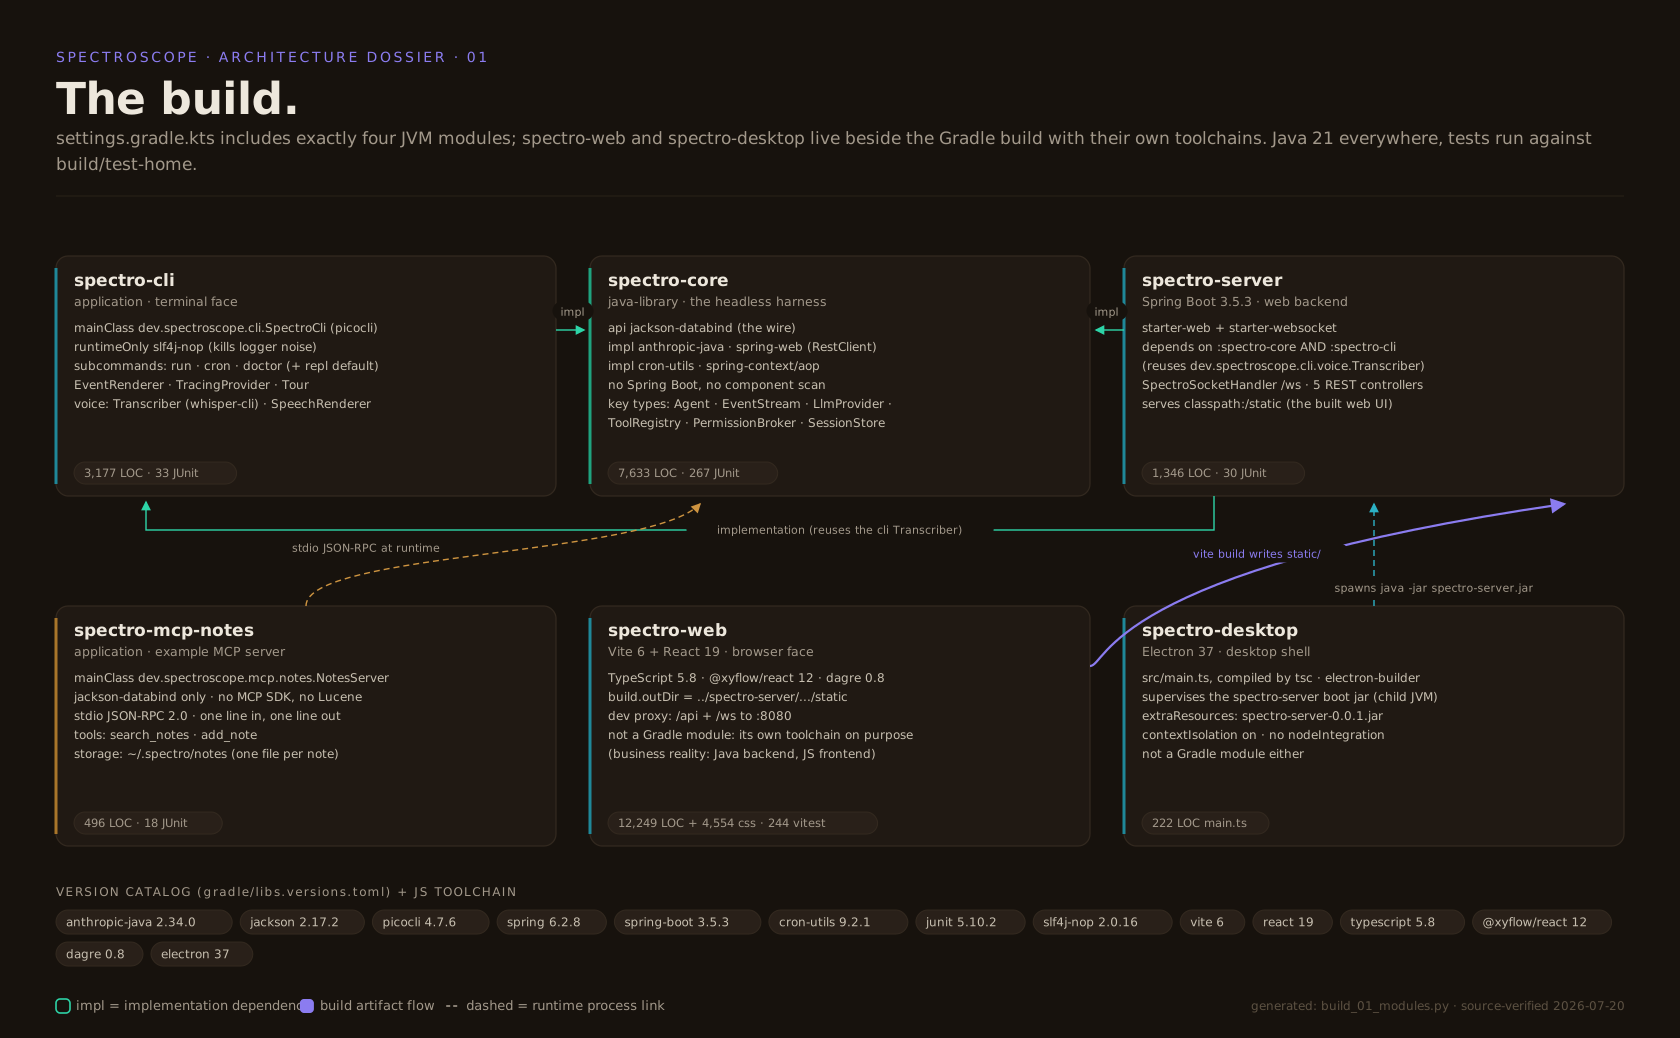
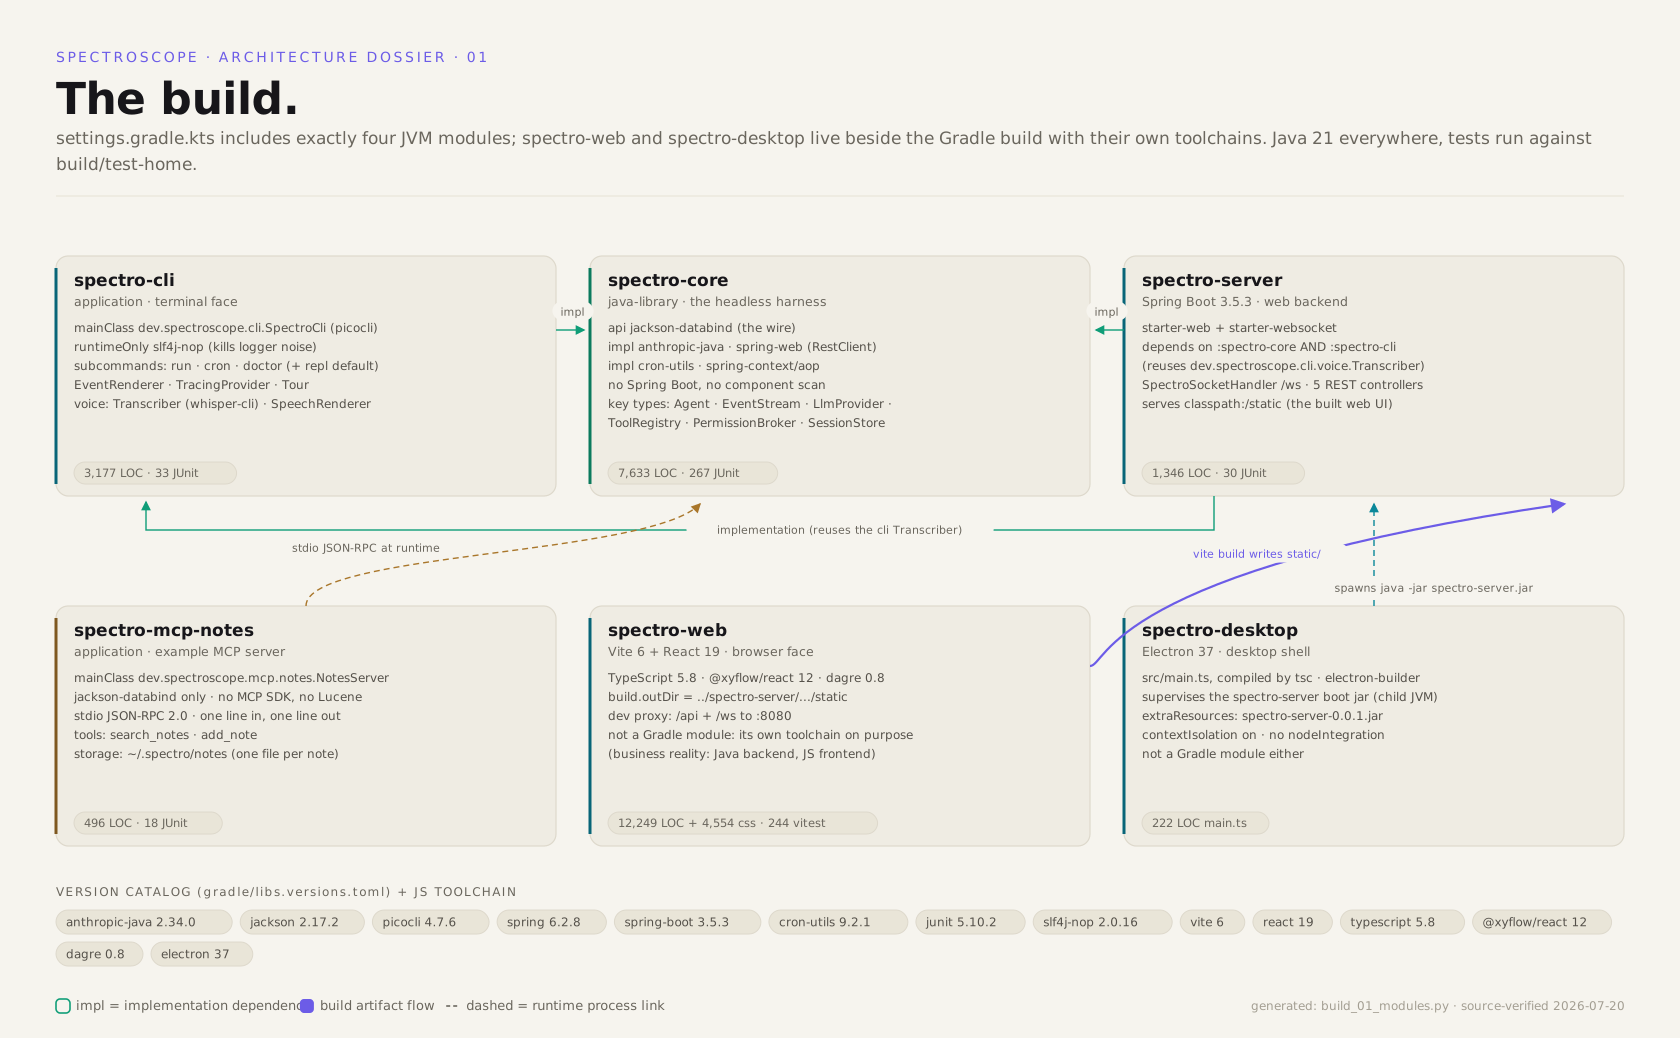
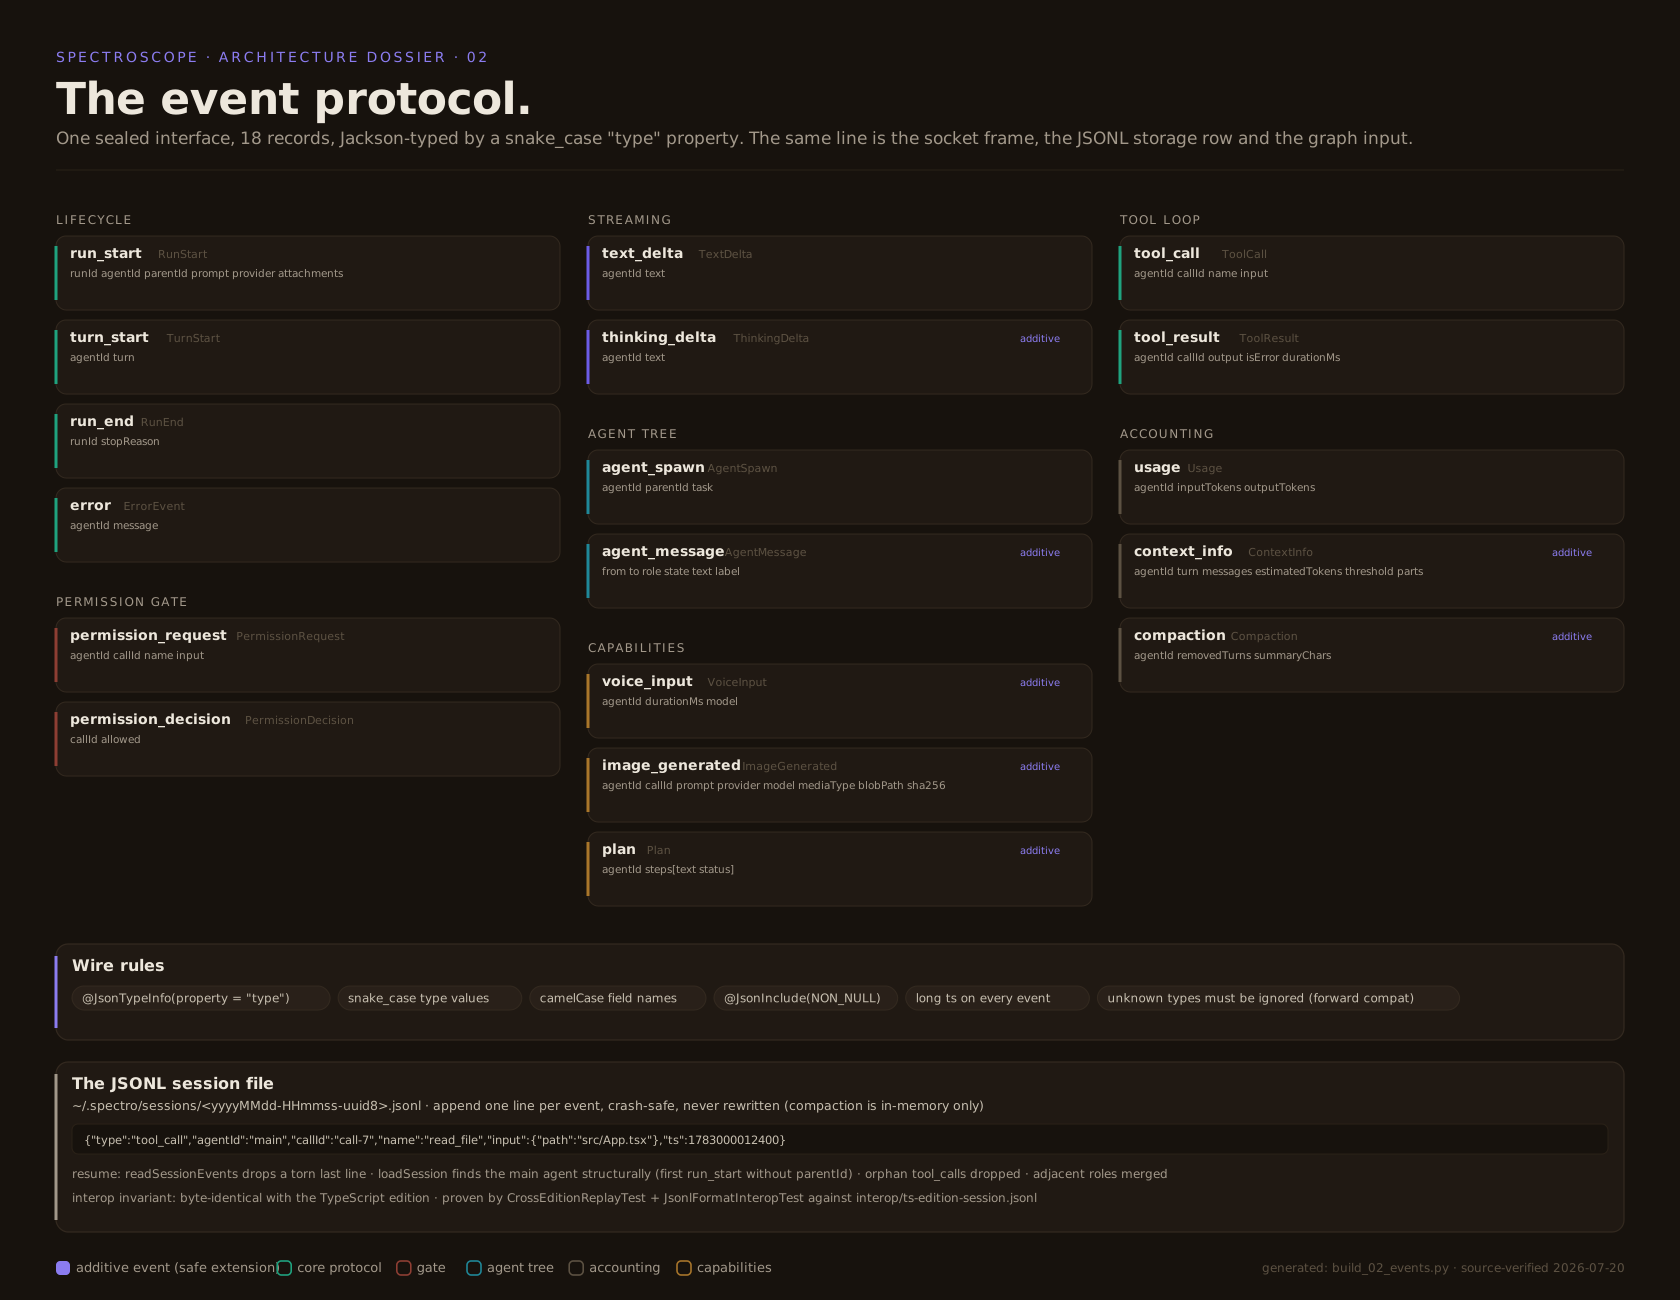
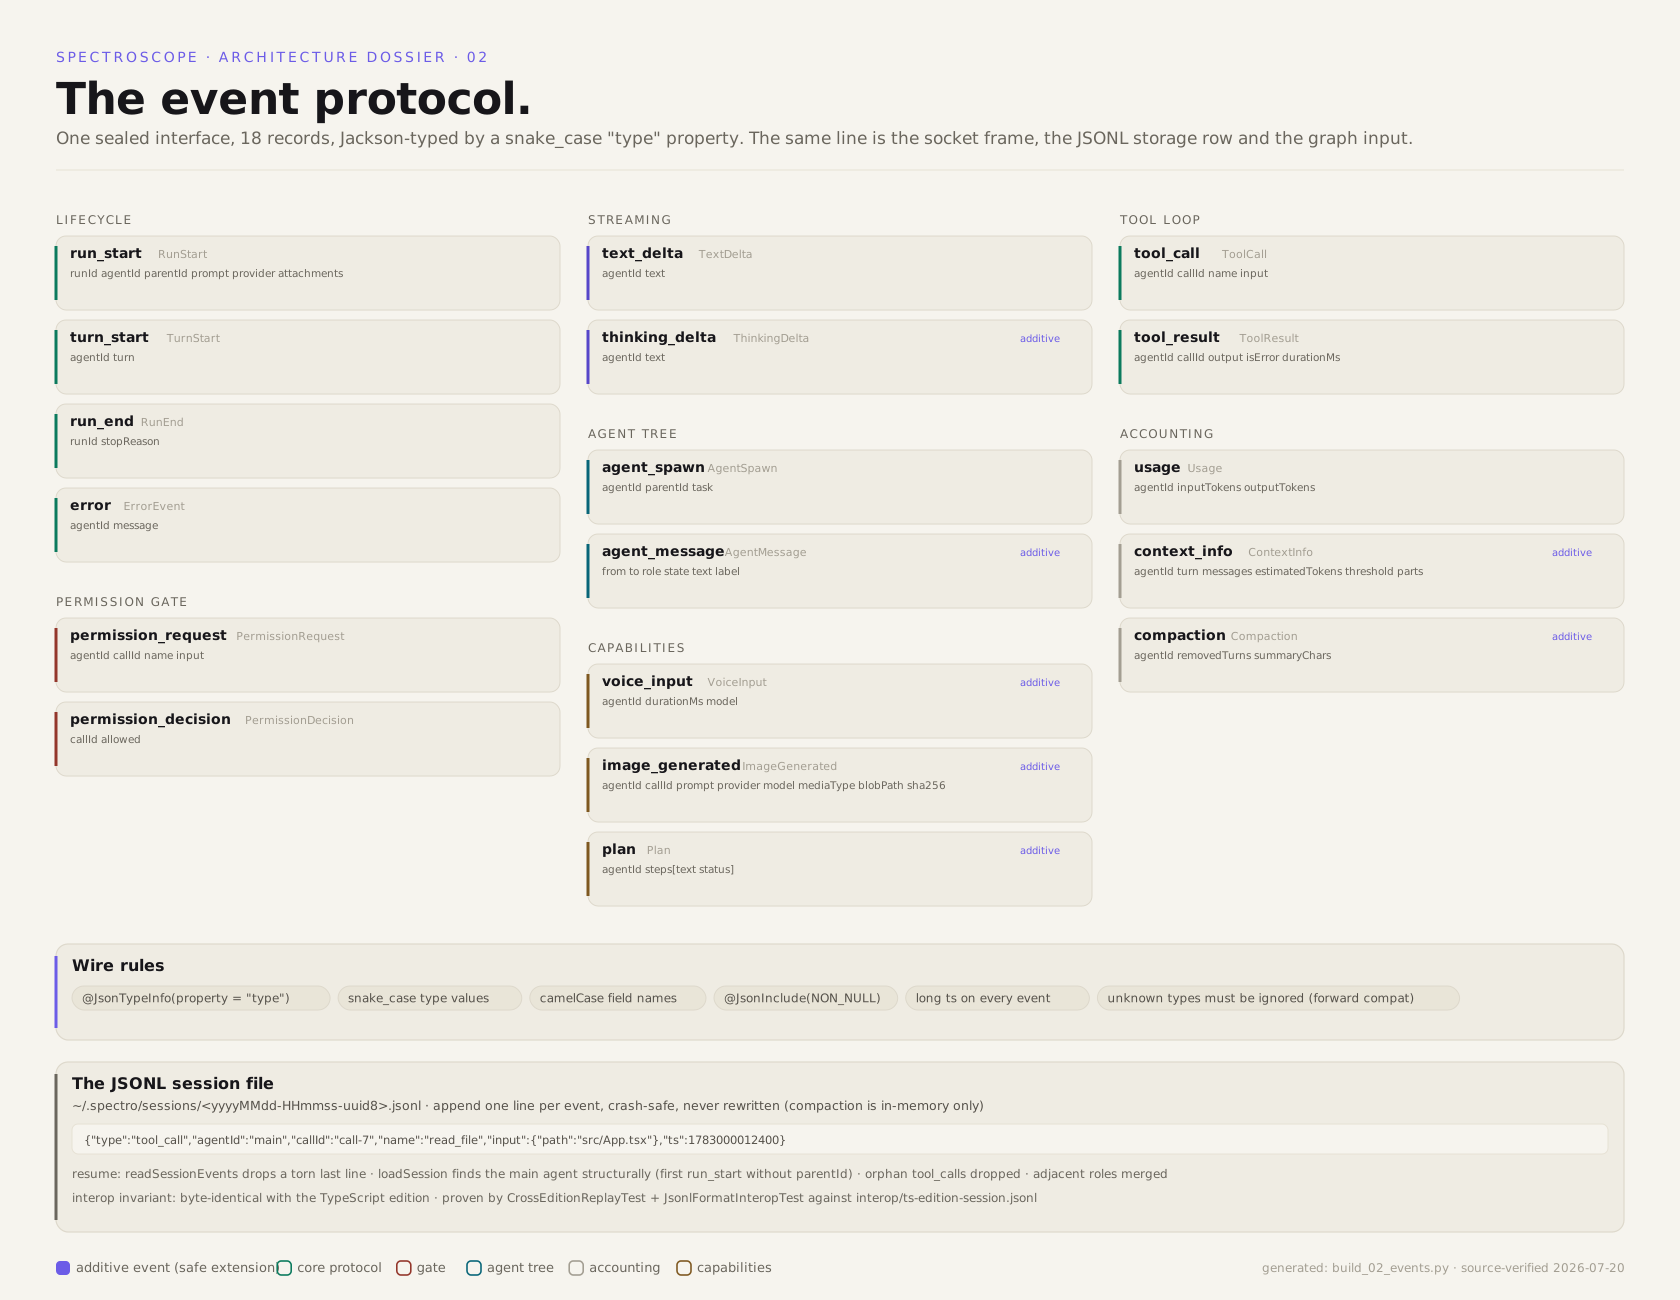
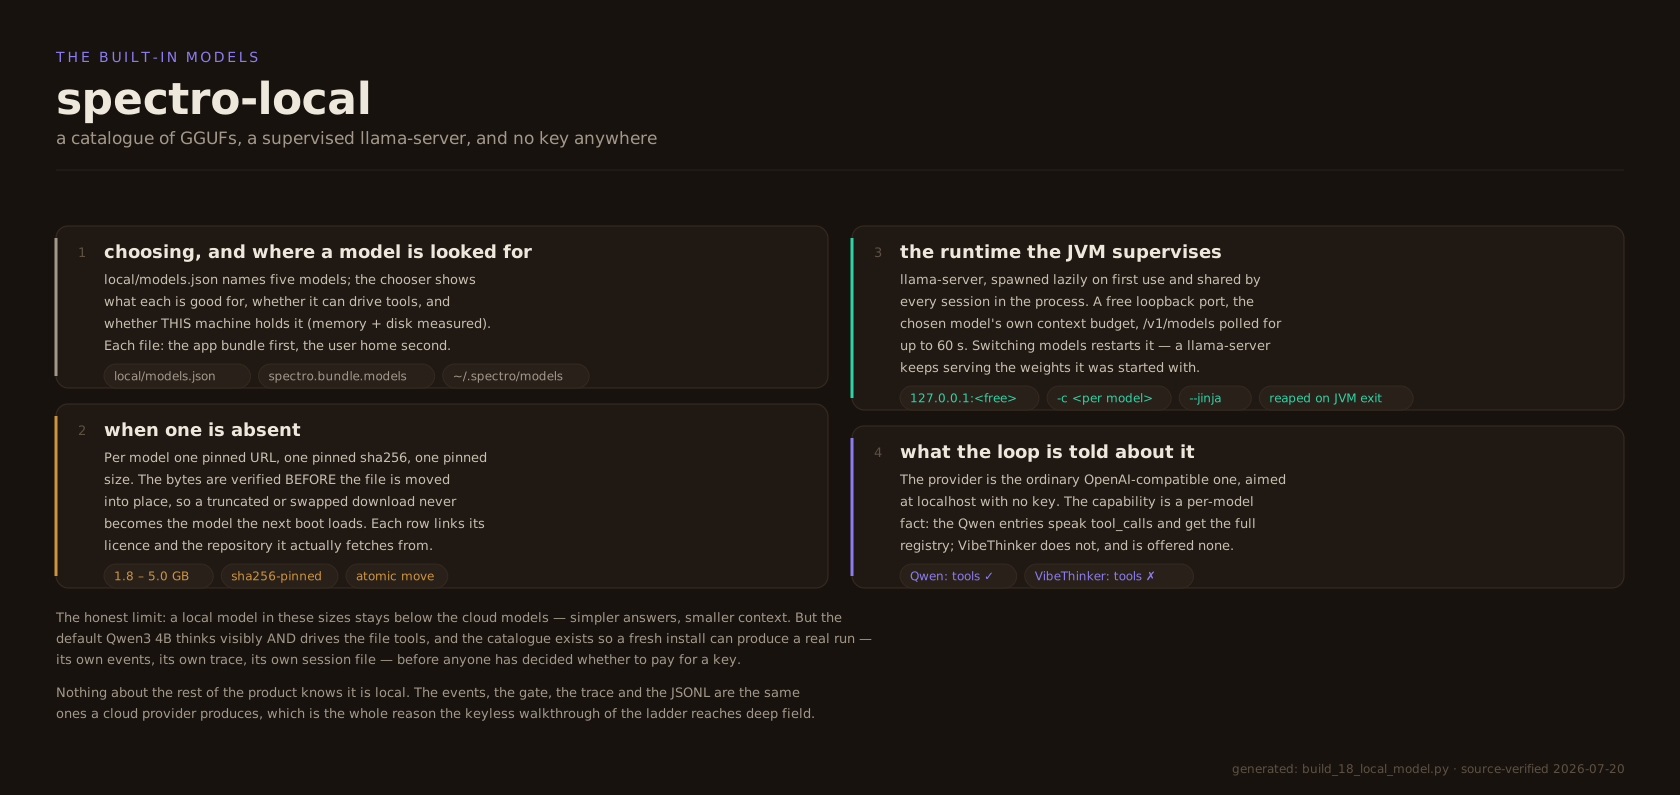
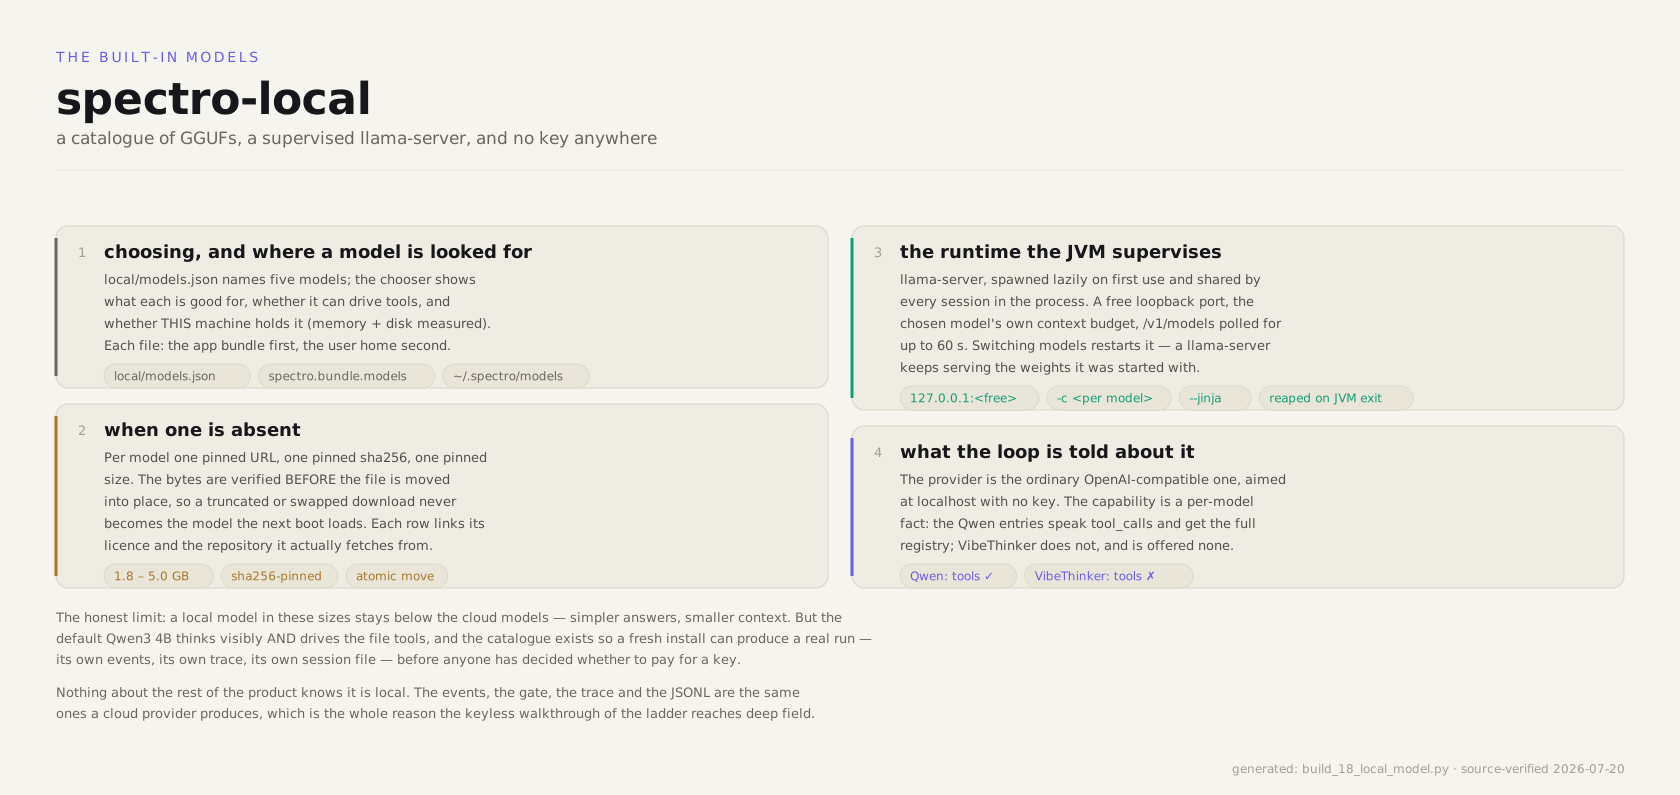
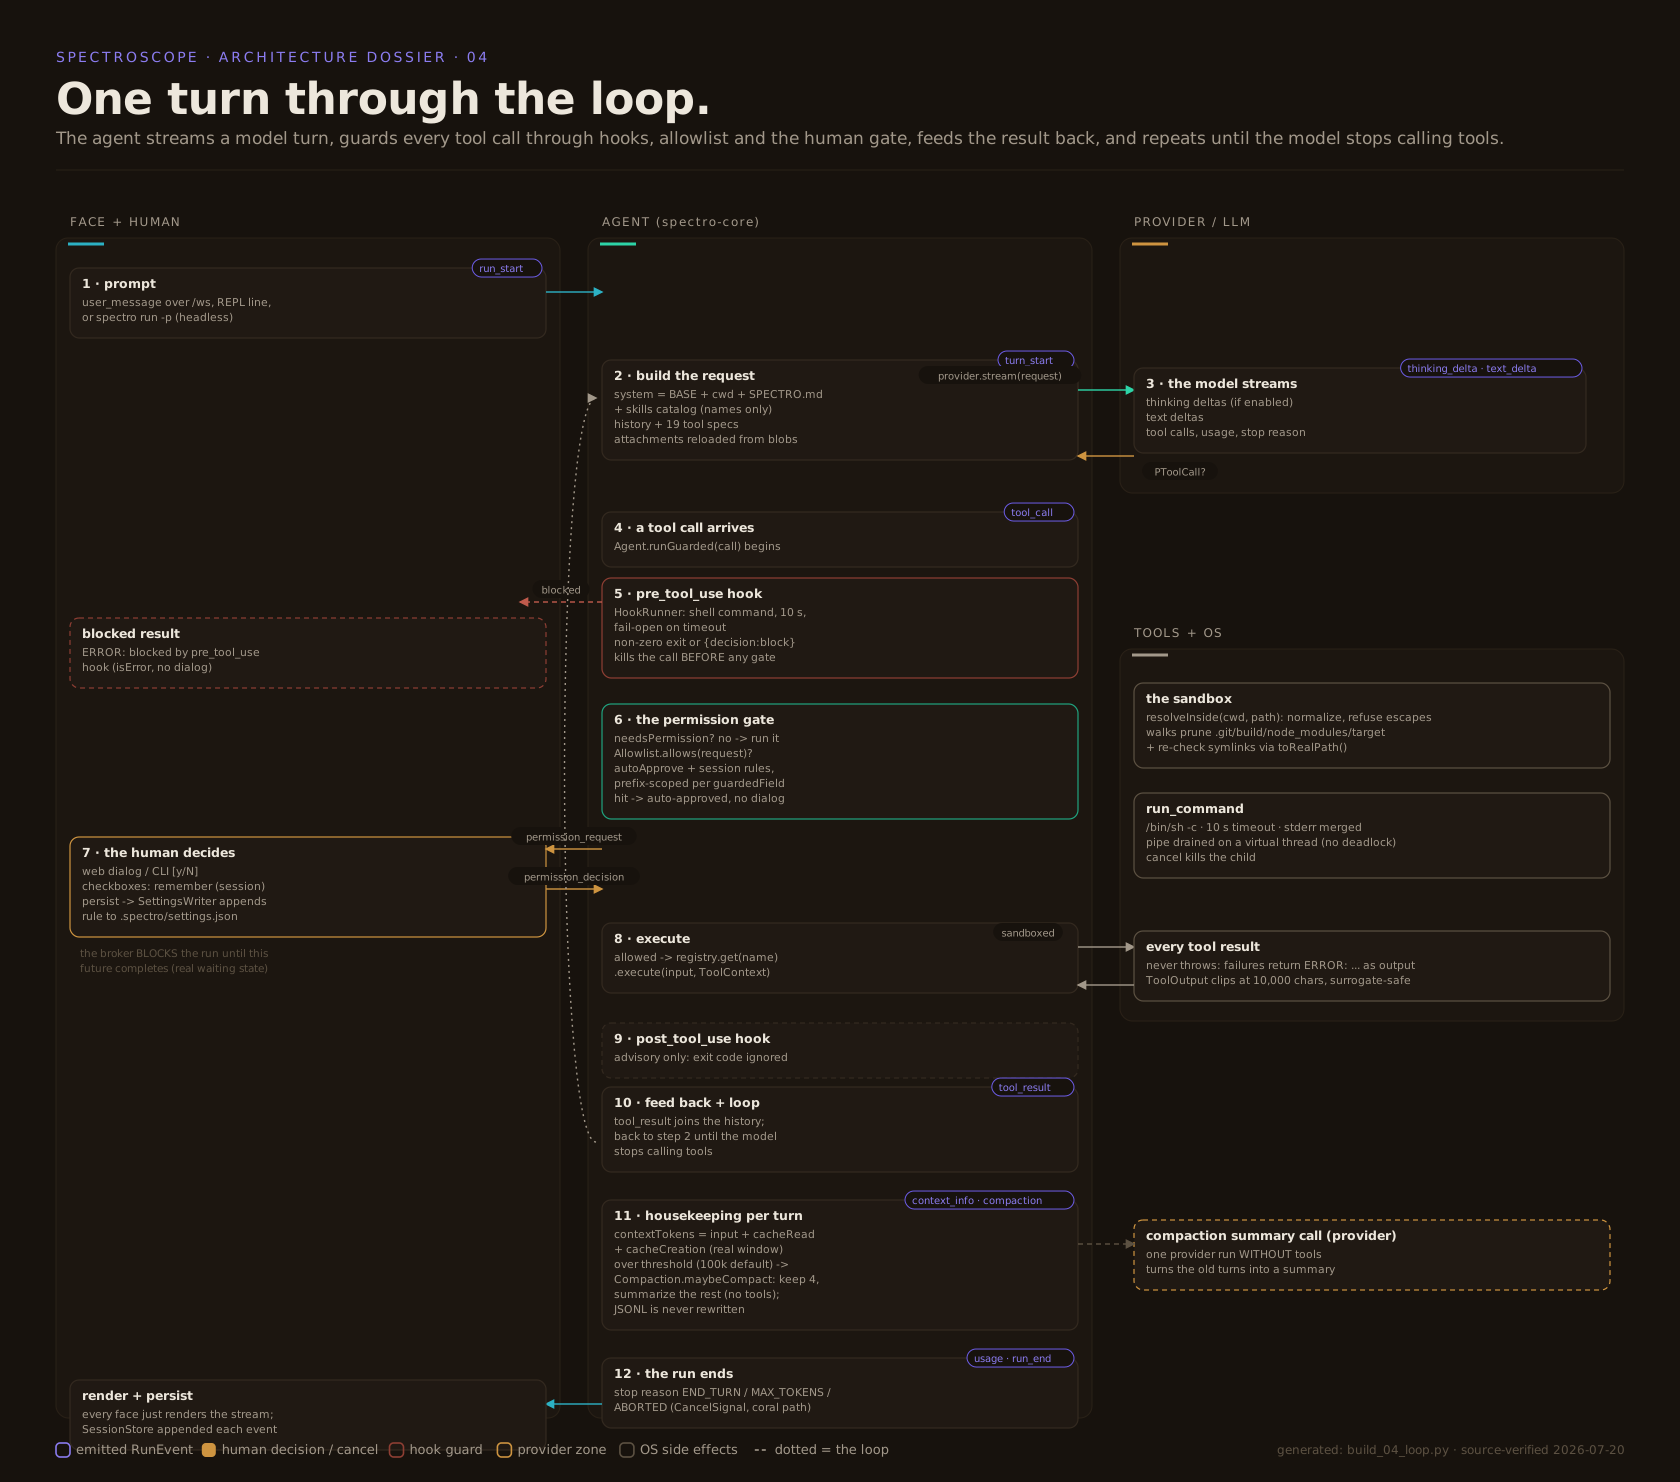
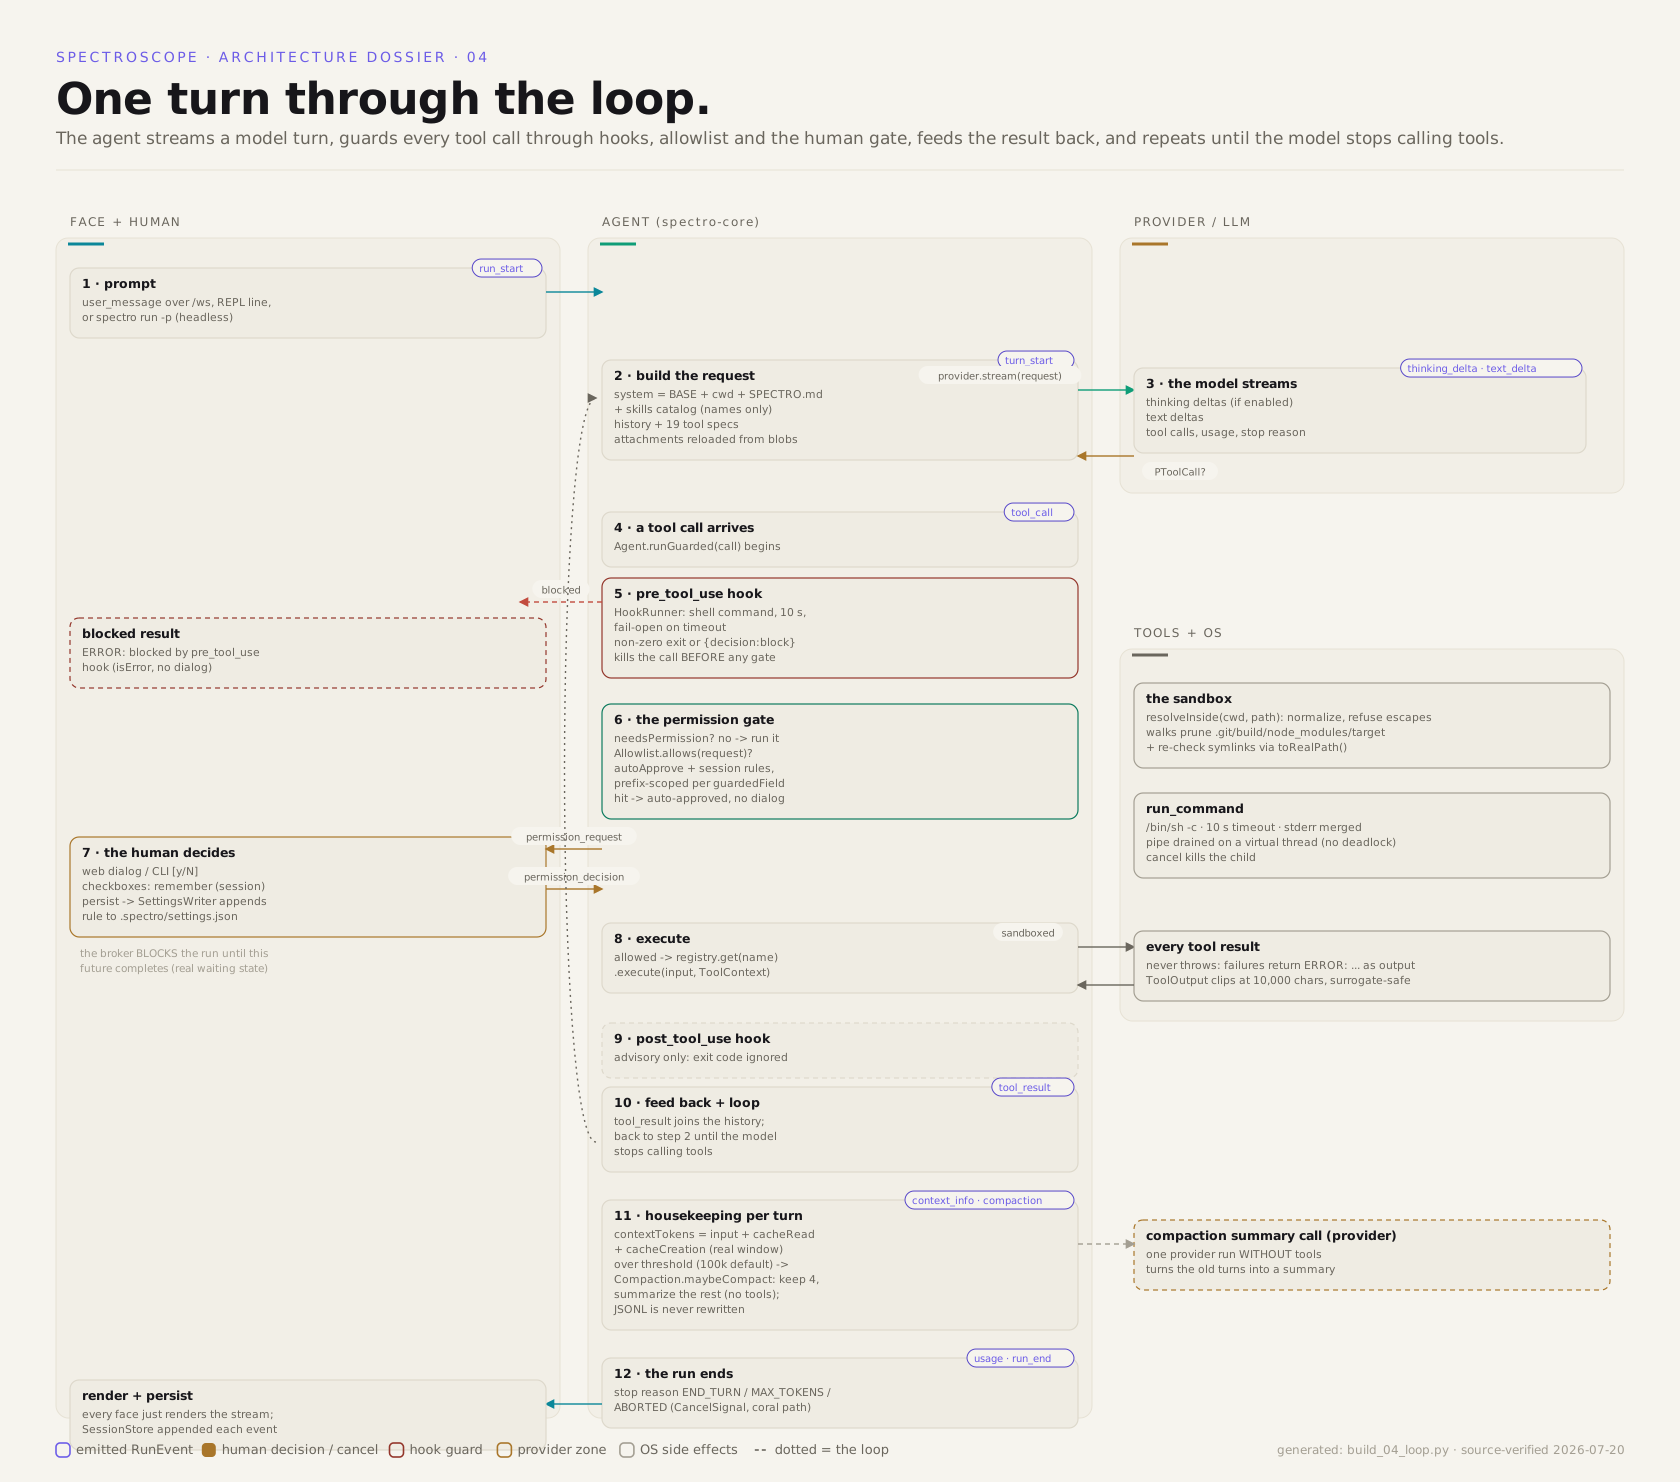
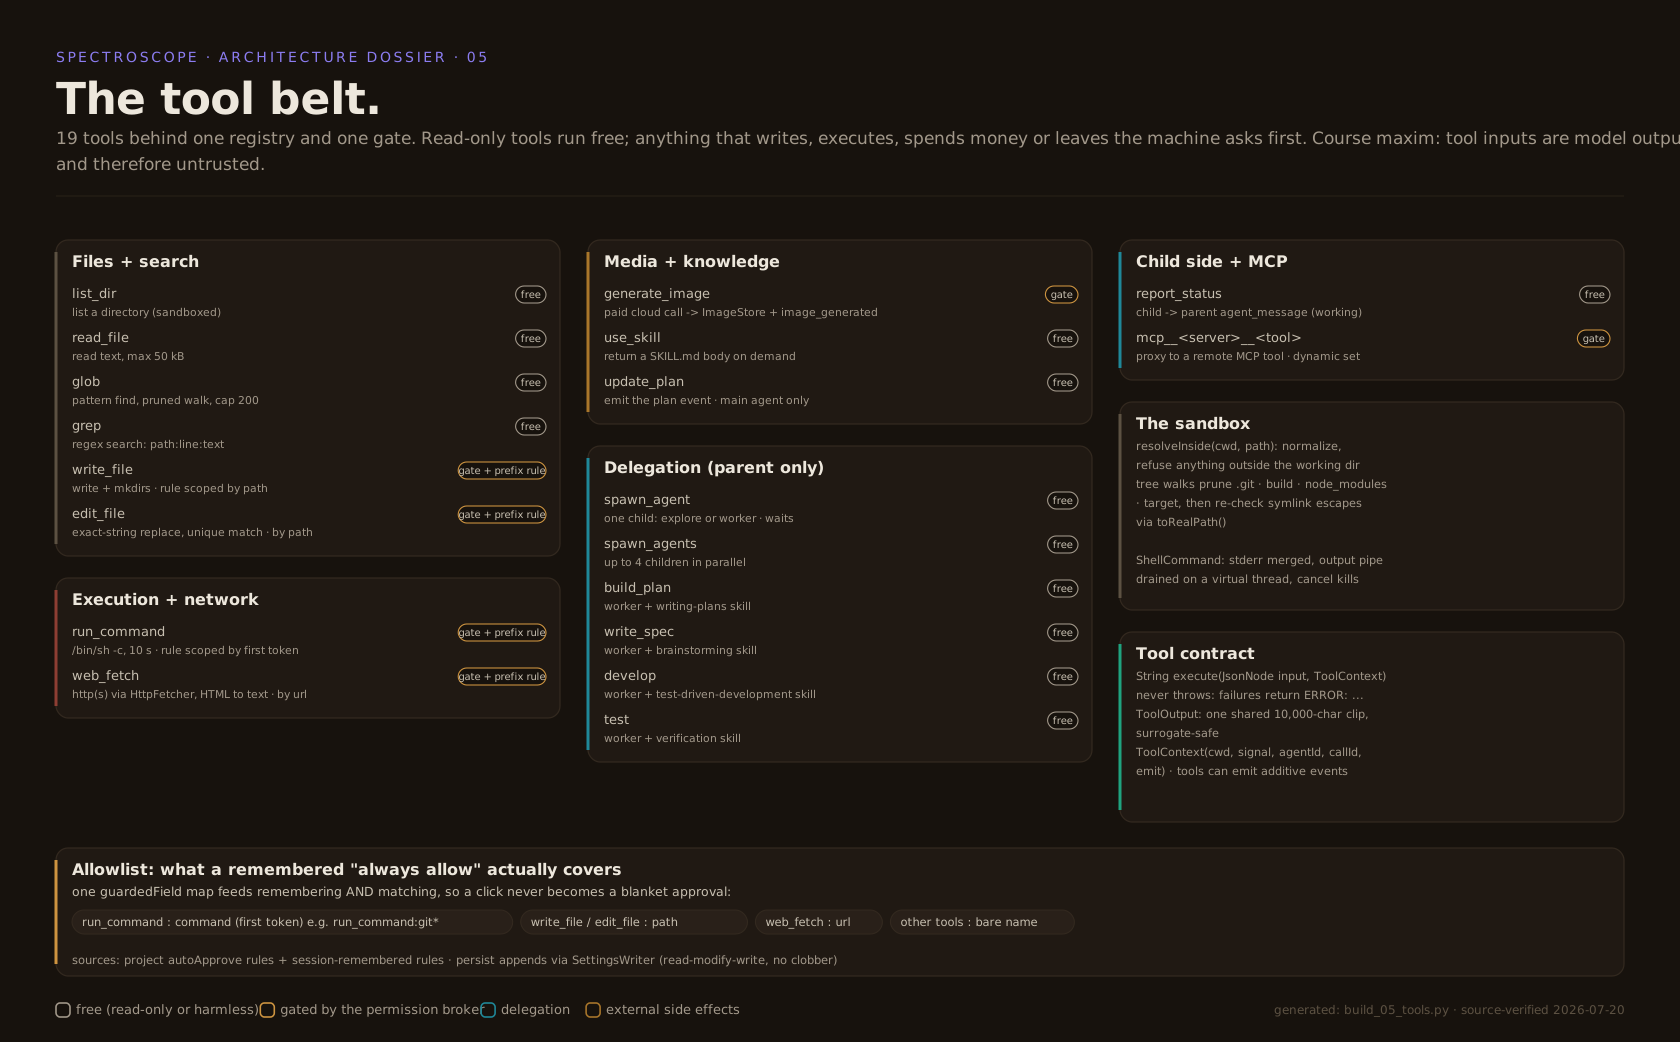
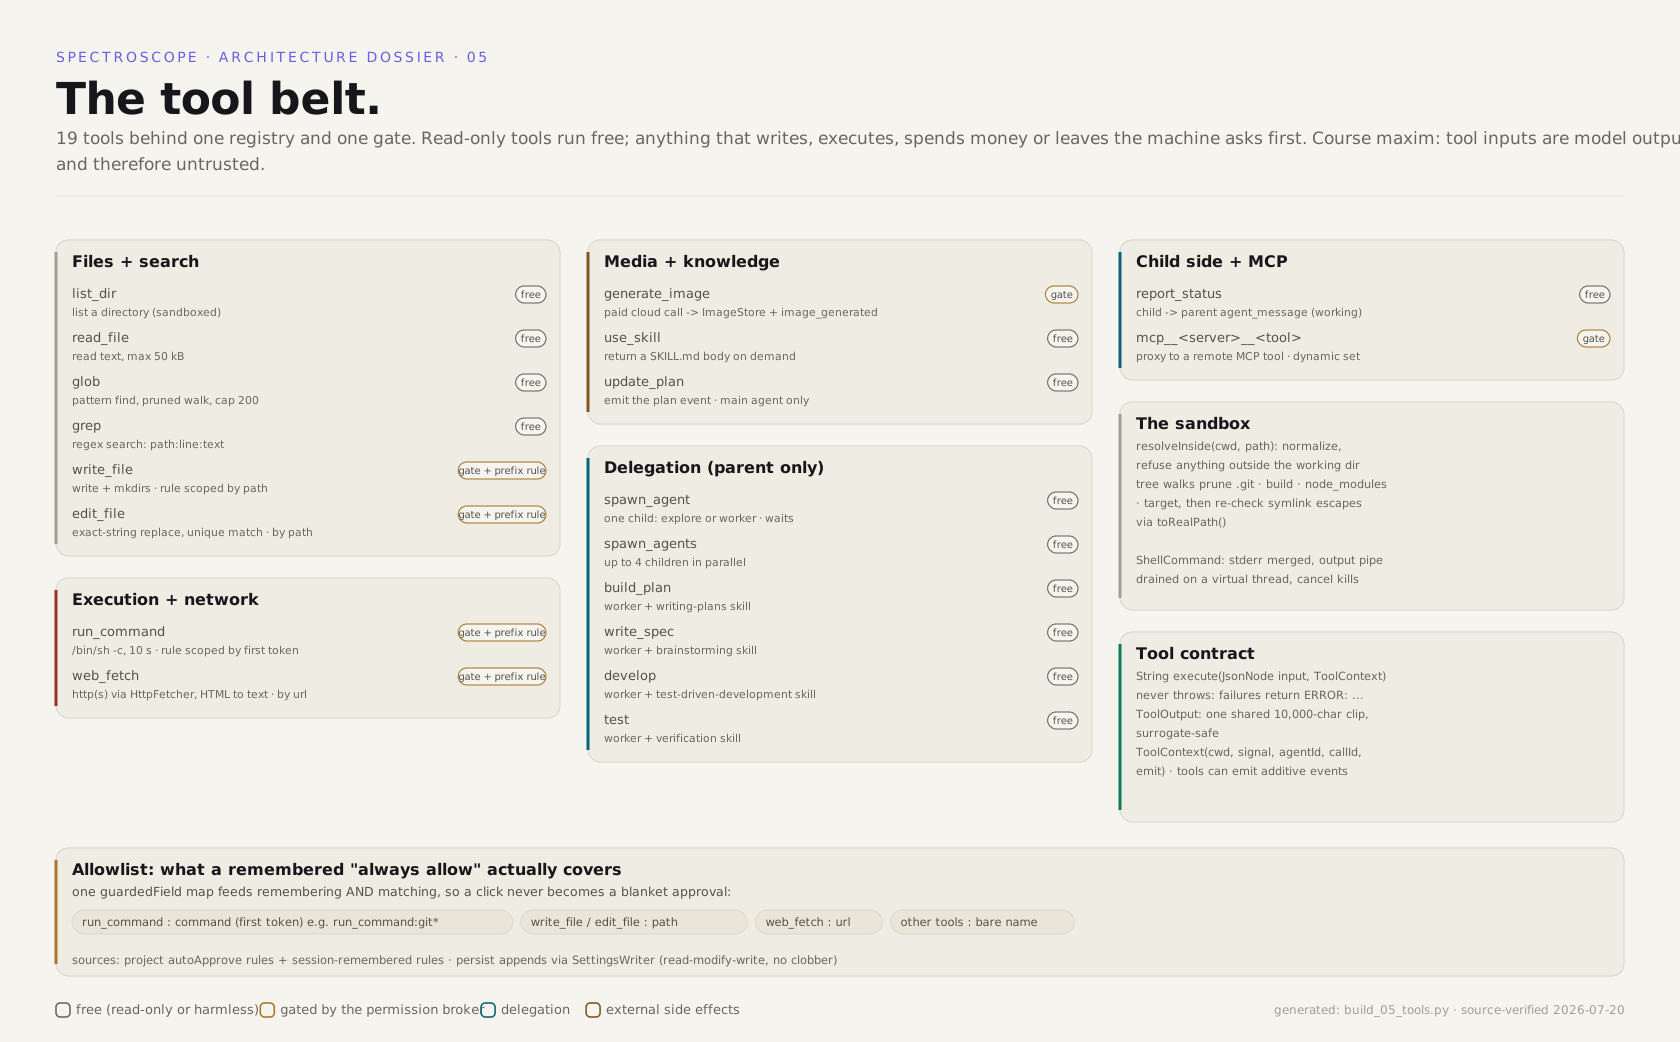
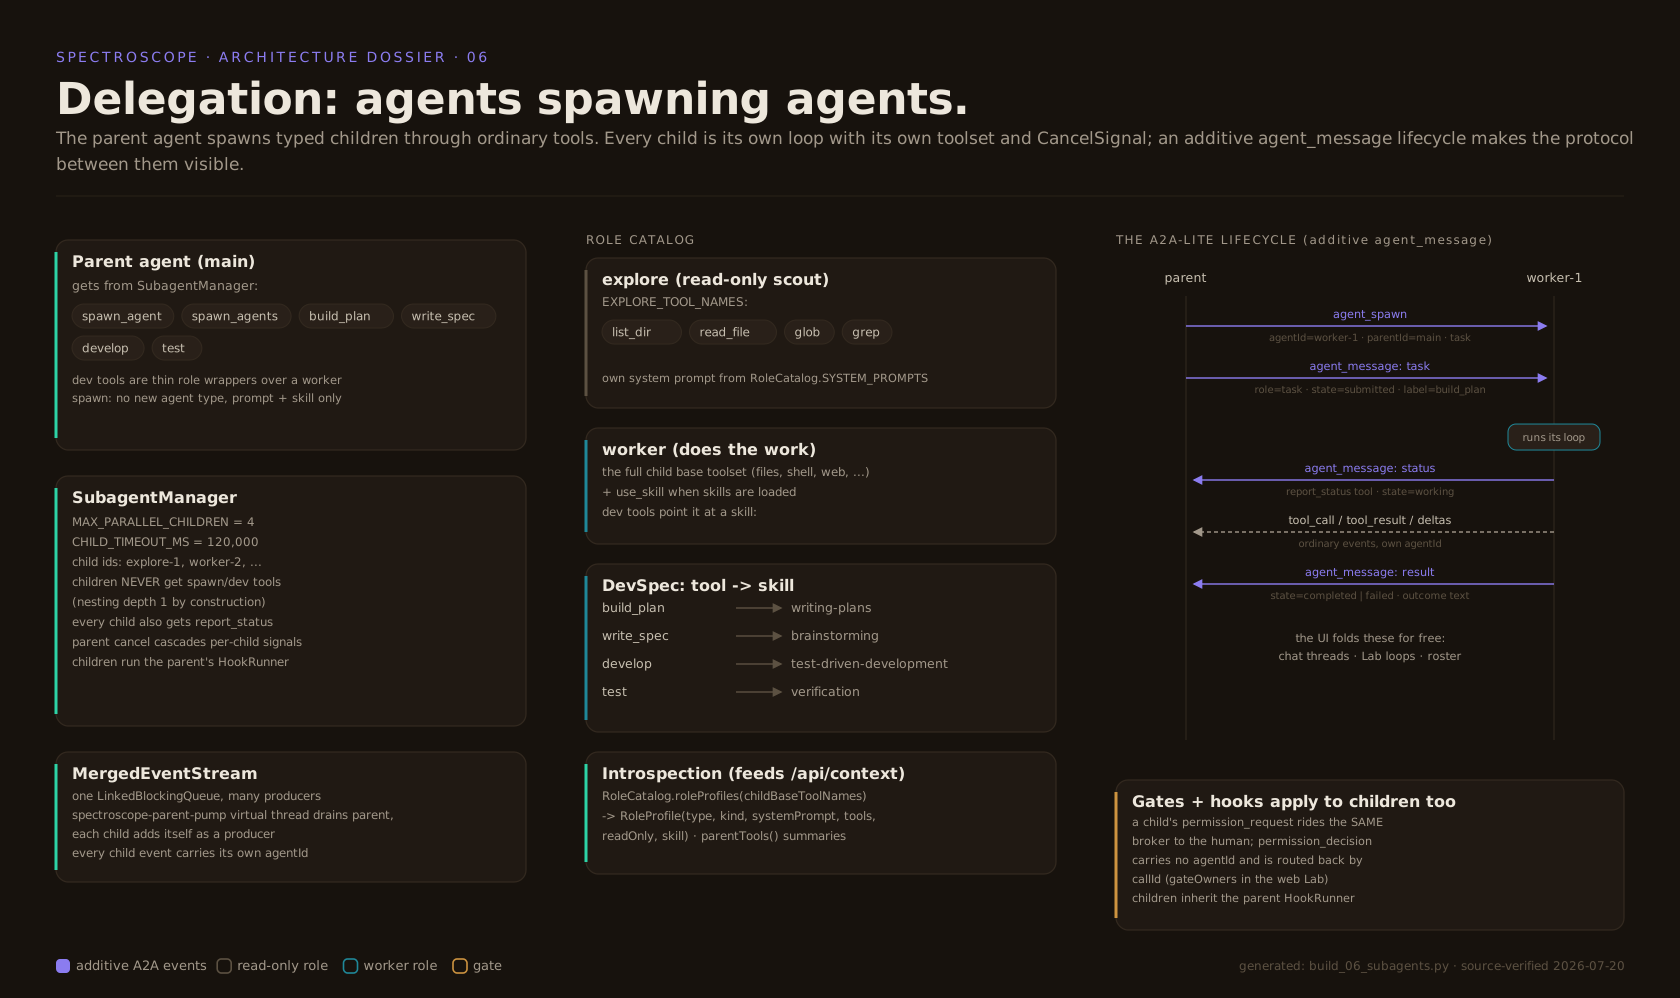
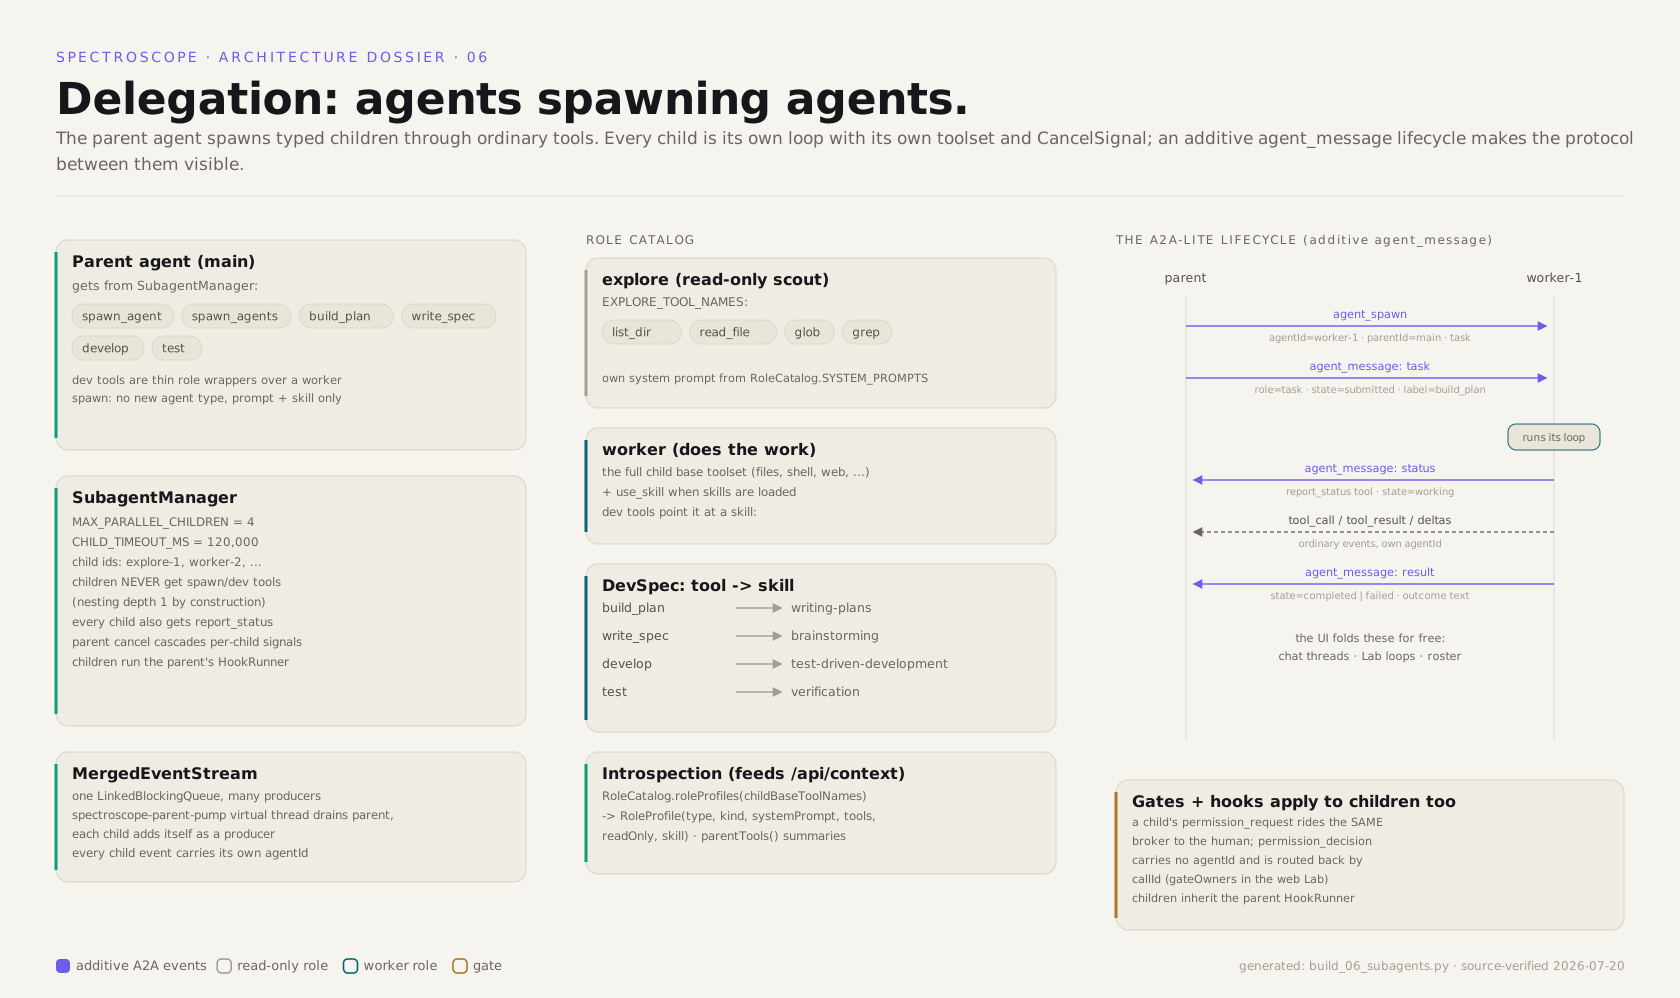
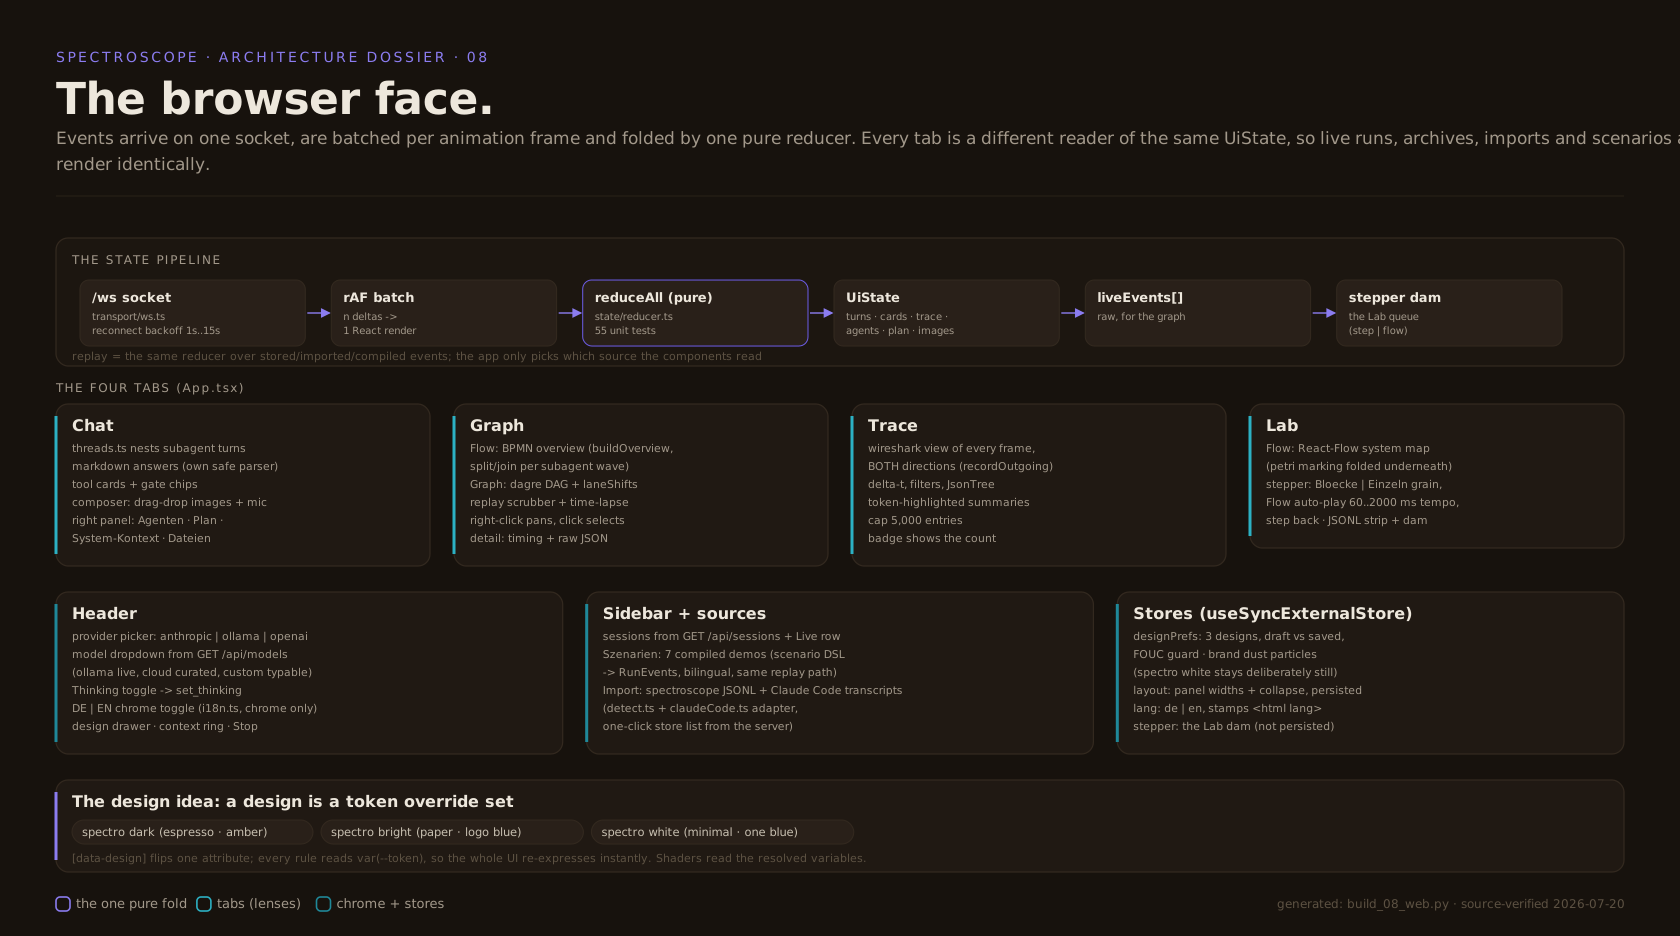
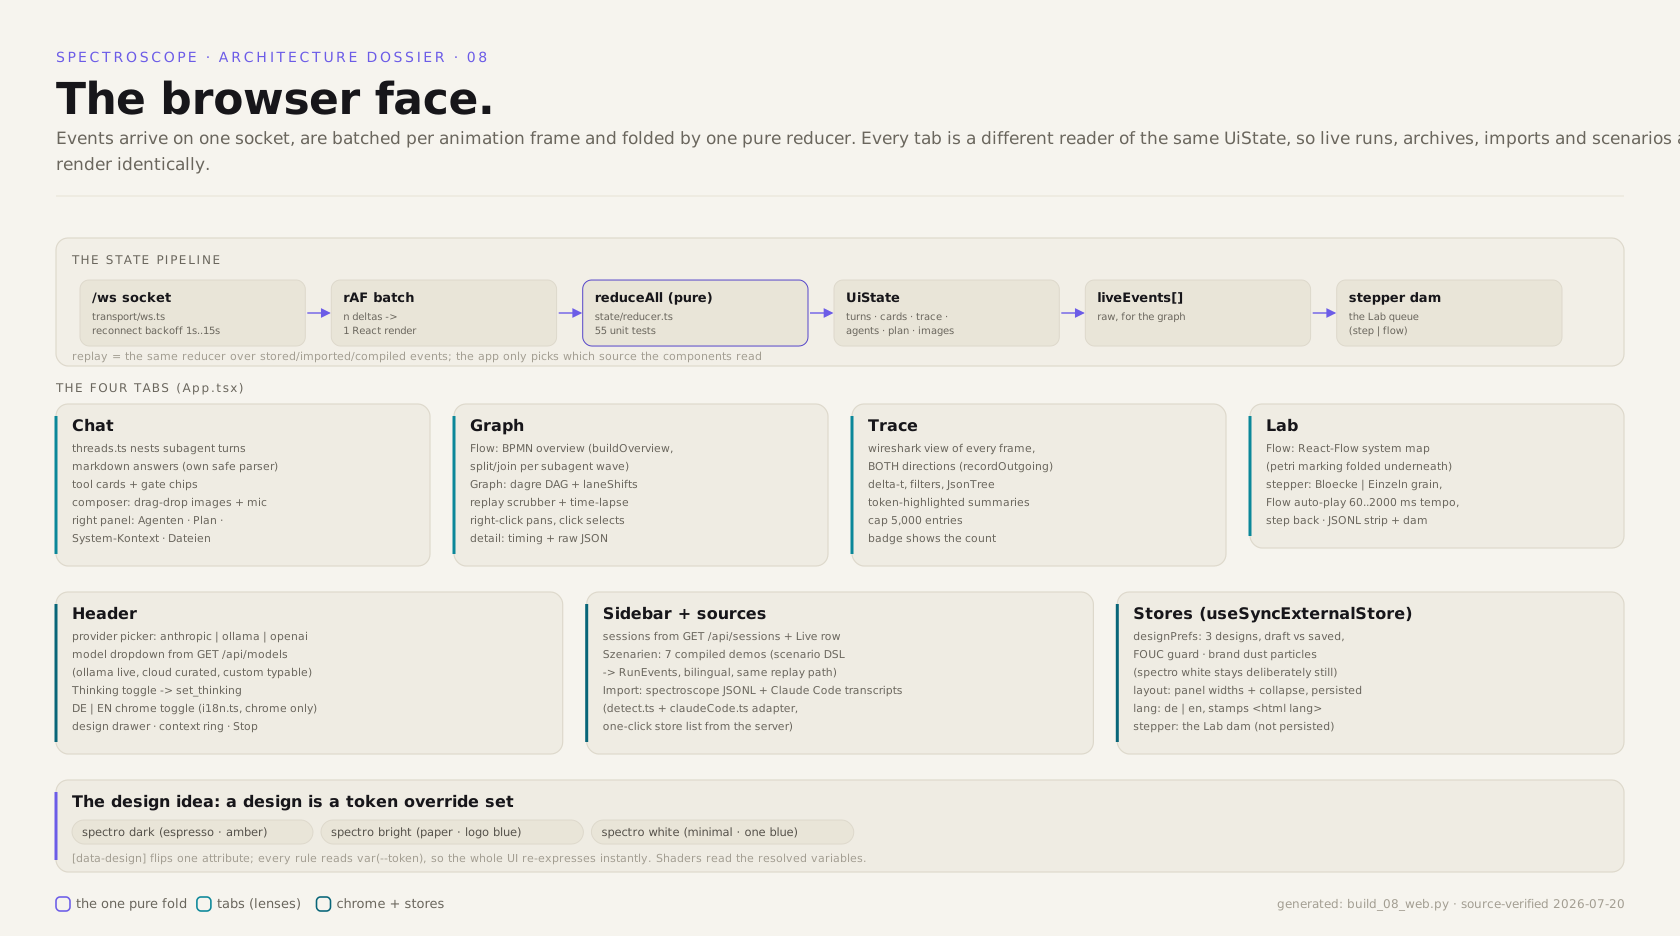
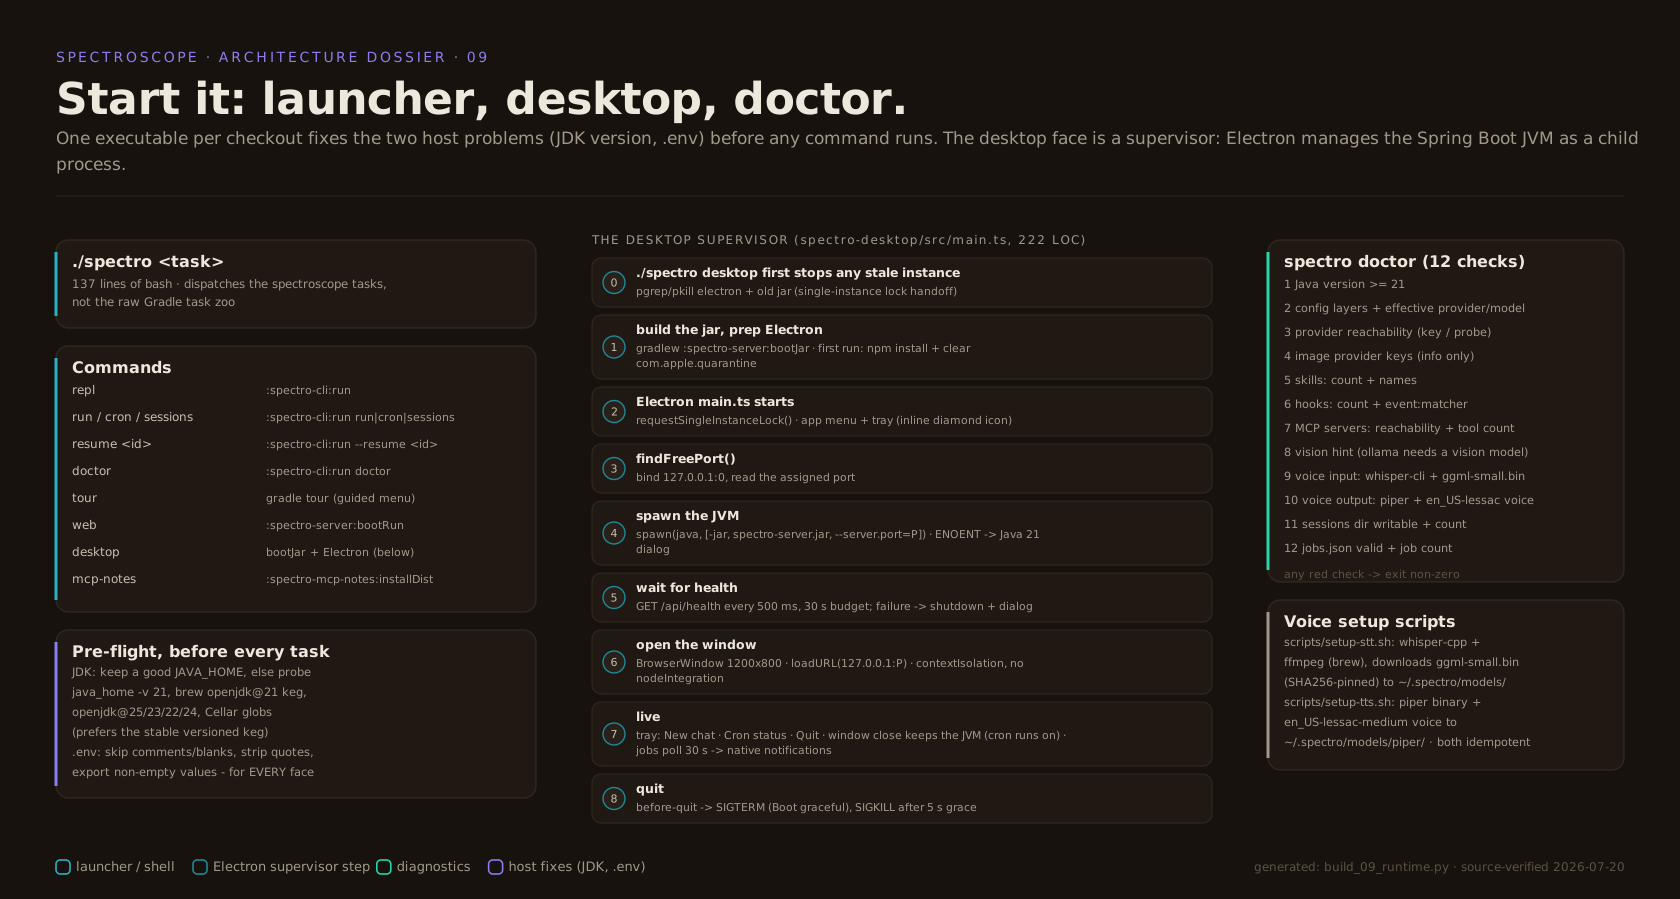
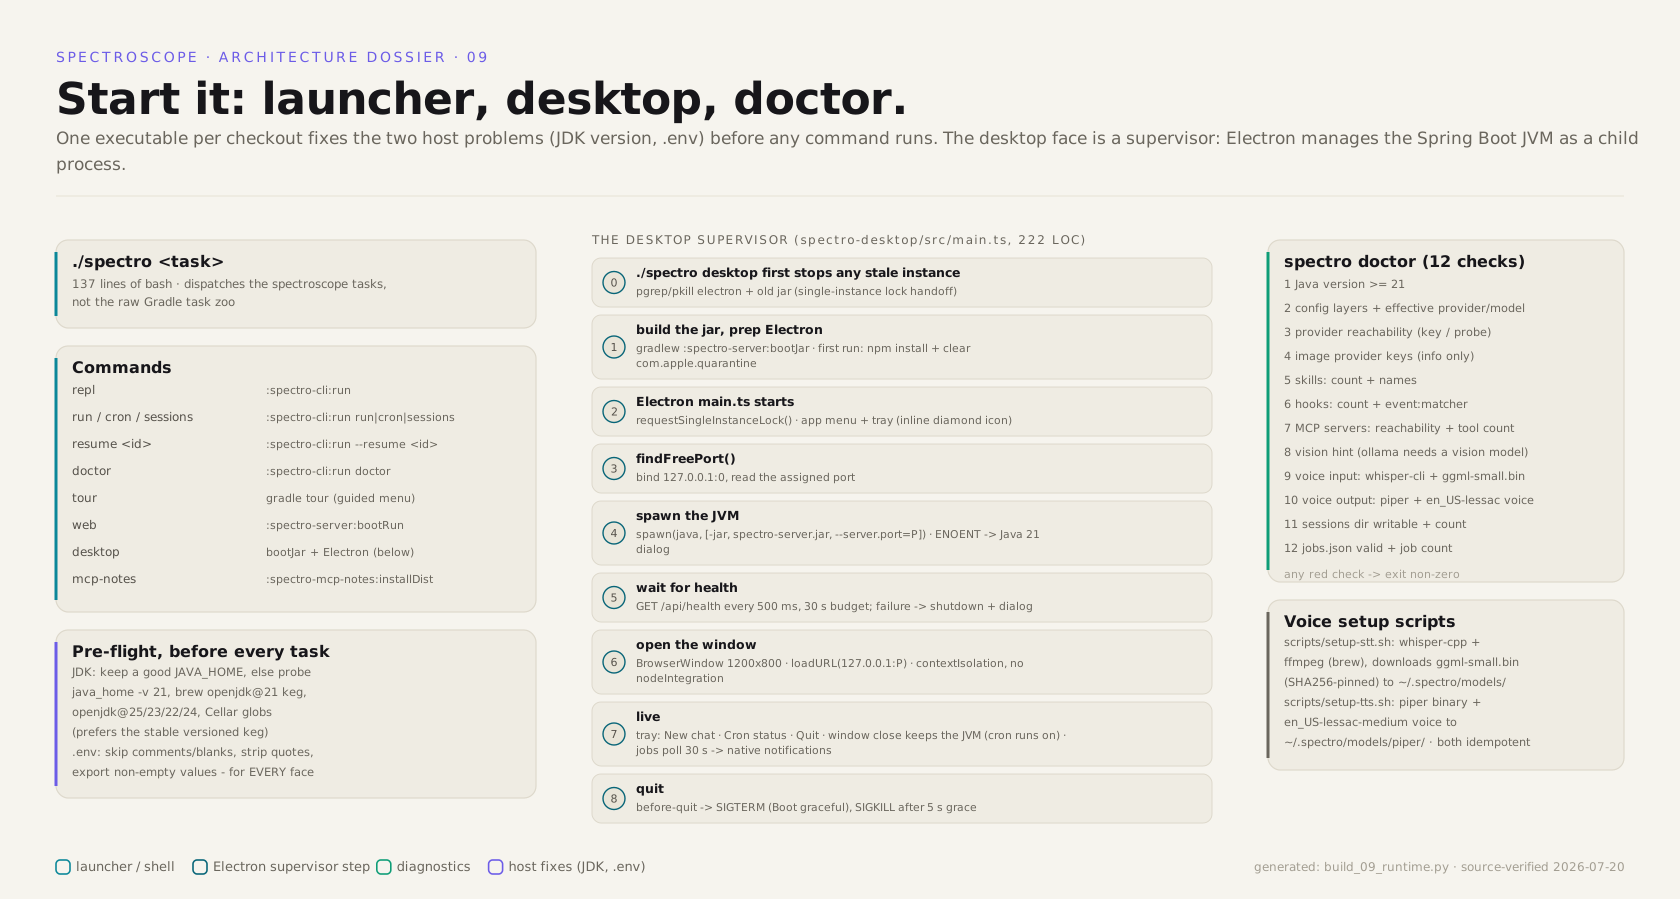
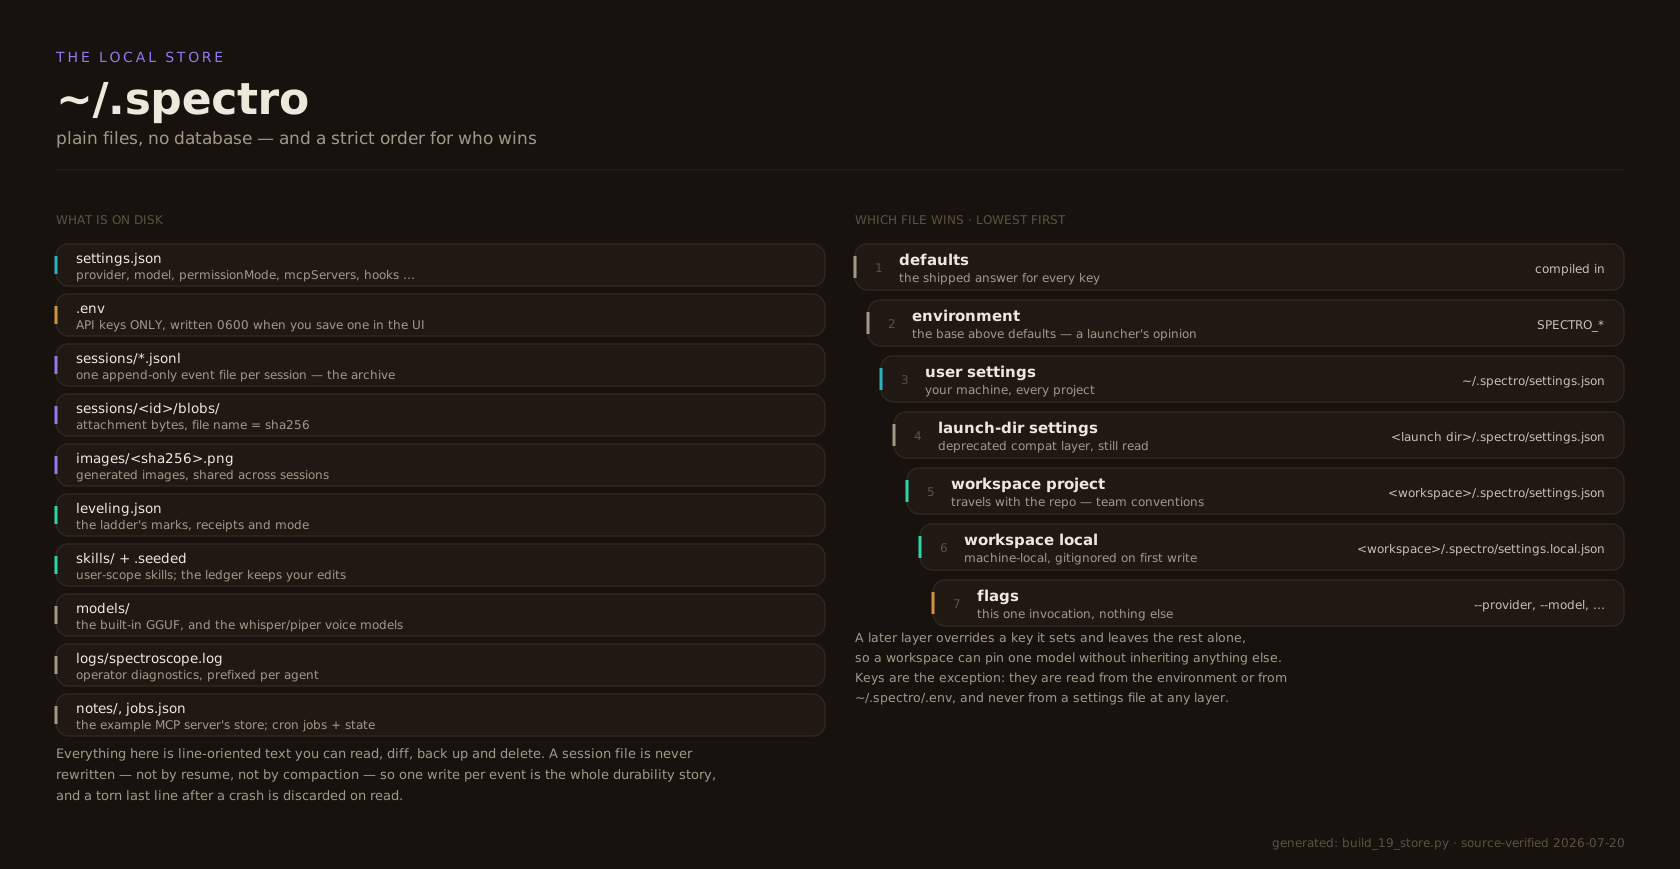
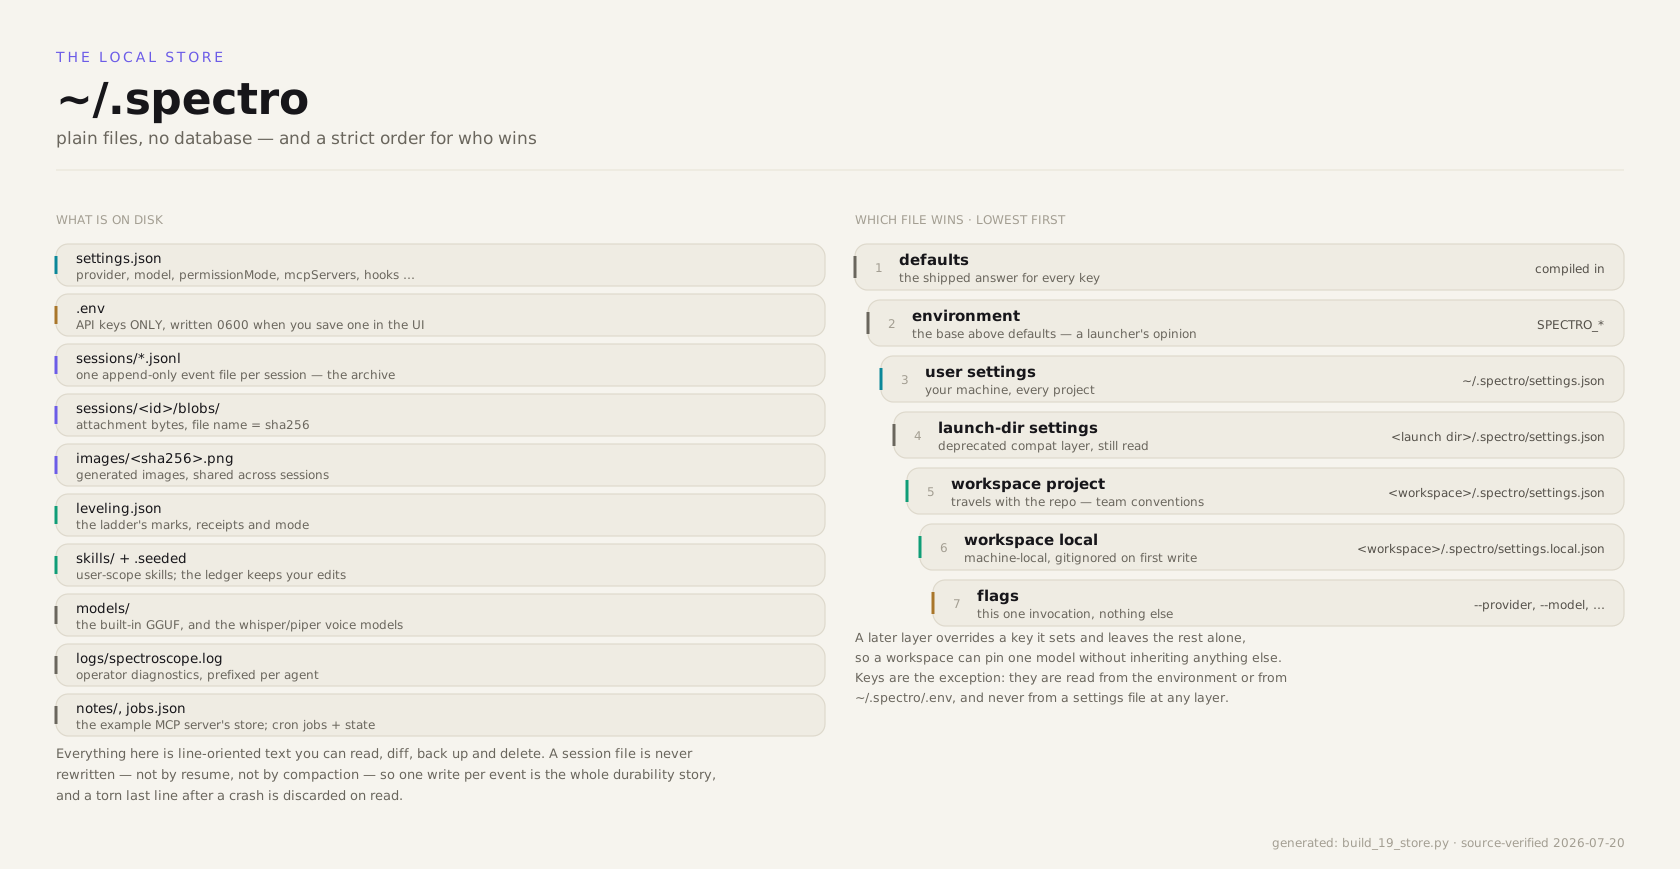
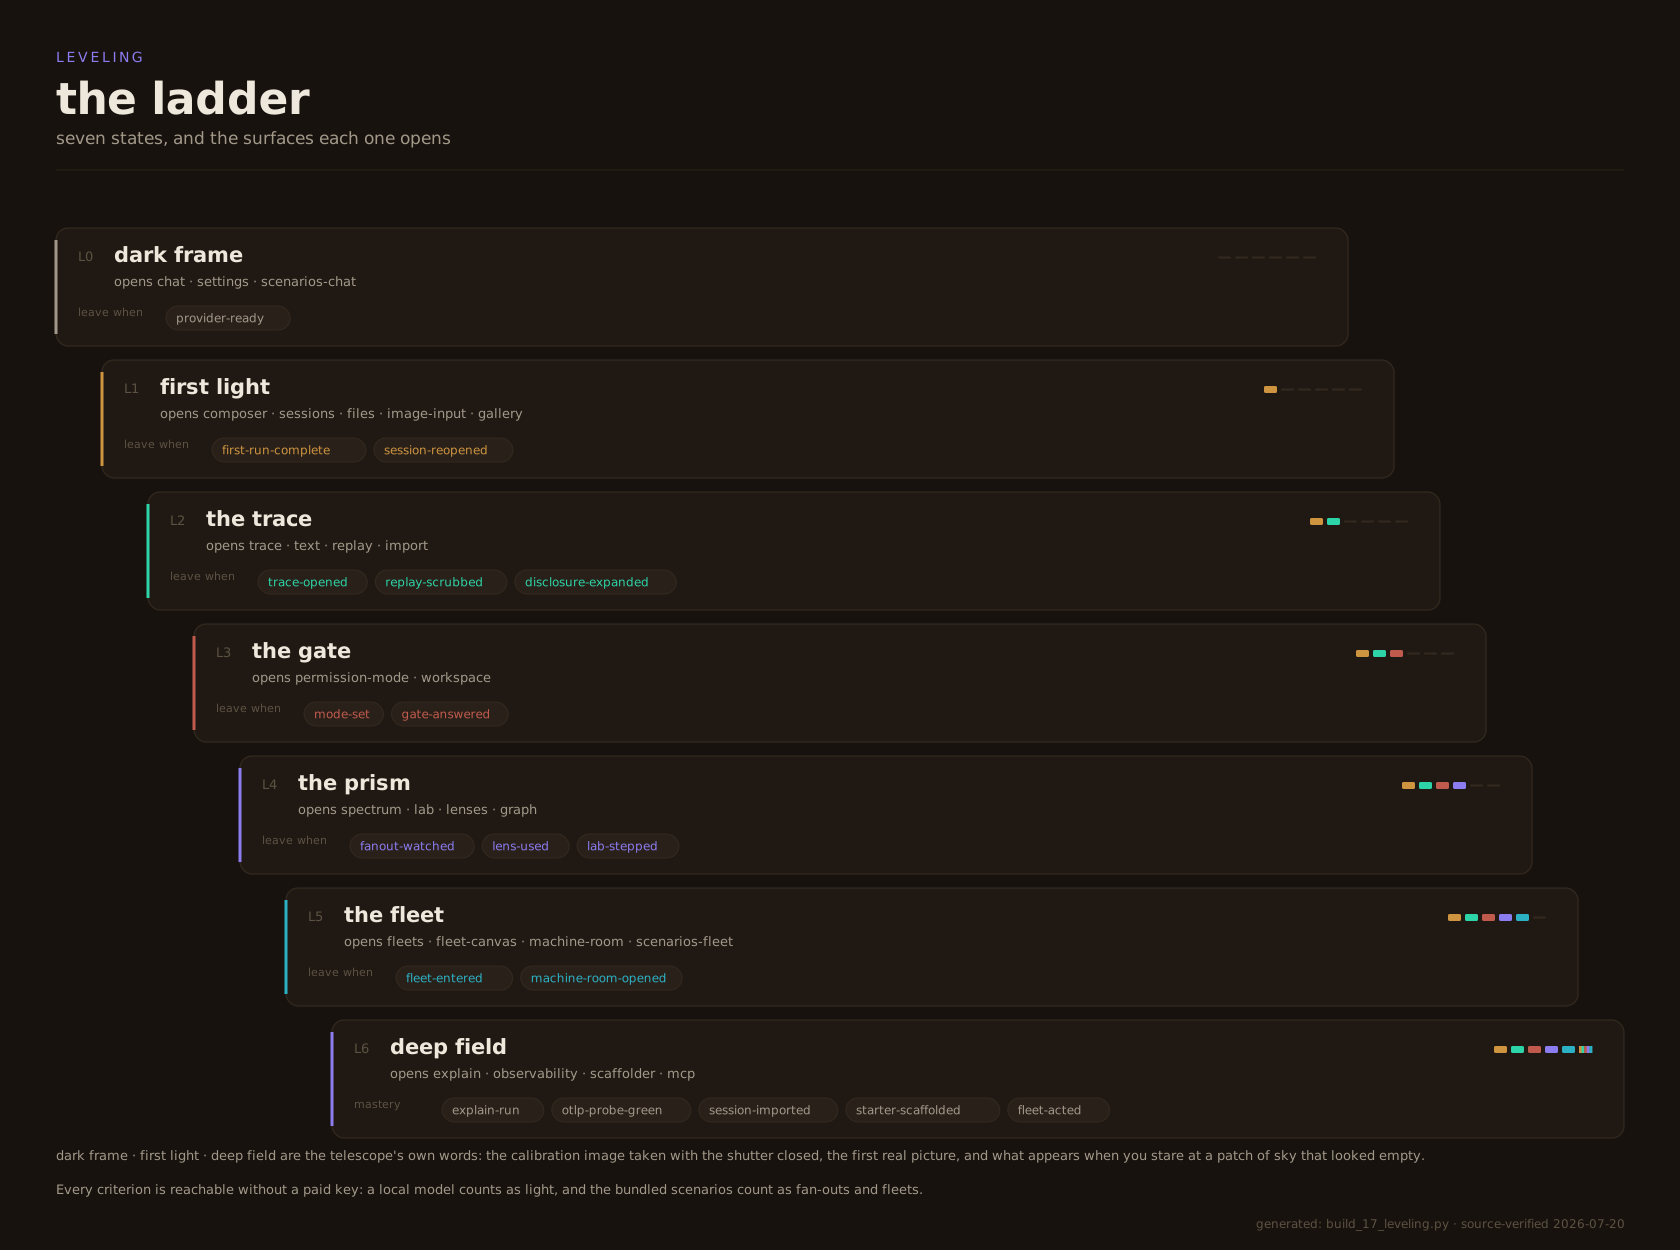
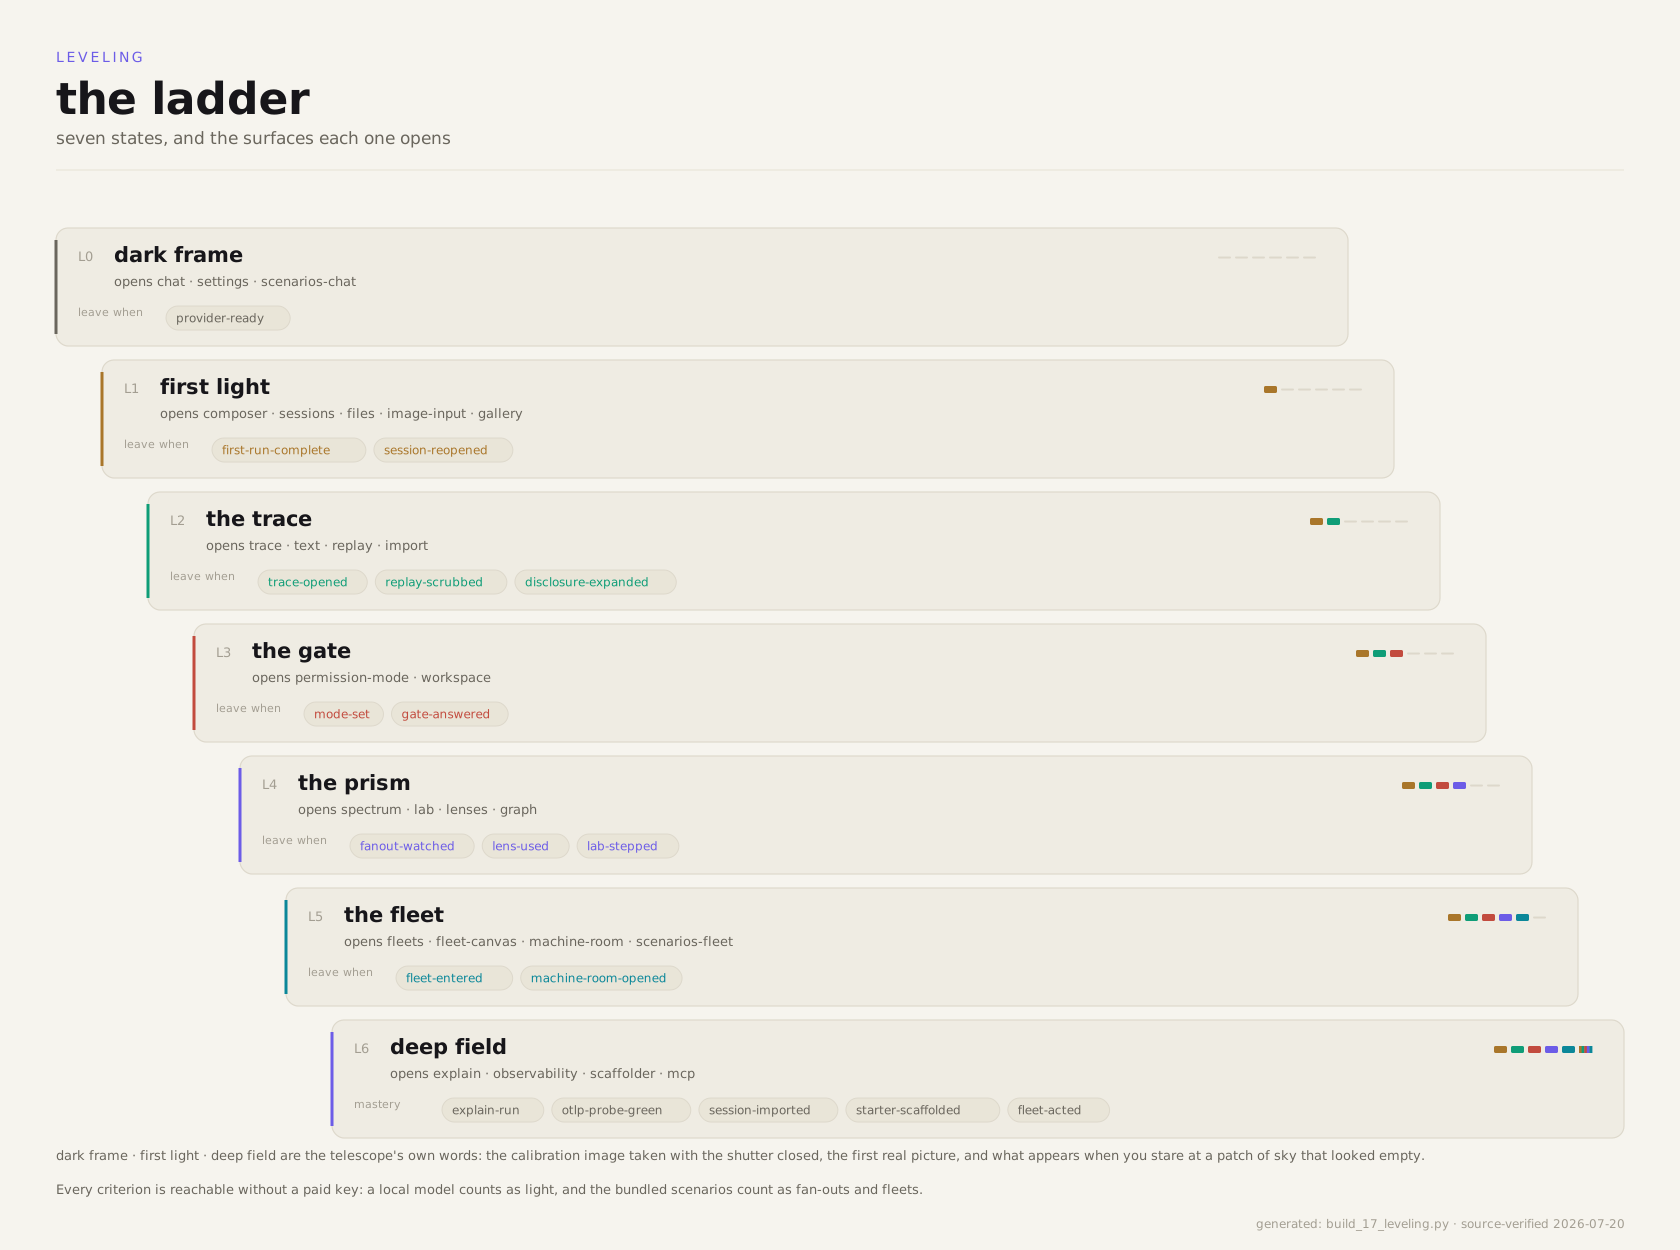
The full dossier — eighteen generated diagrams, the same ones the product handbook carries. Every class name, wire string, endpoint and count in them was read from the repository, and each comes from a rerunnable generator: change the system, rerun the script, the diagram is current again.
The big picture
The protocol layer
The model side
The loop and the belt
Delegation
The web face
Runtime and integration
The ladder
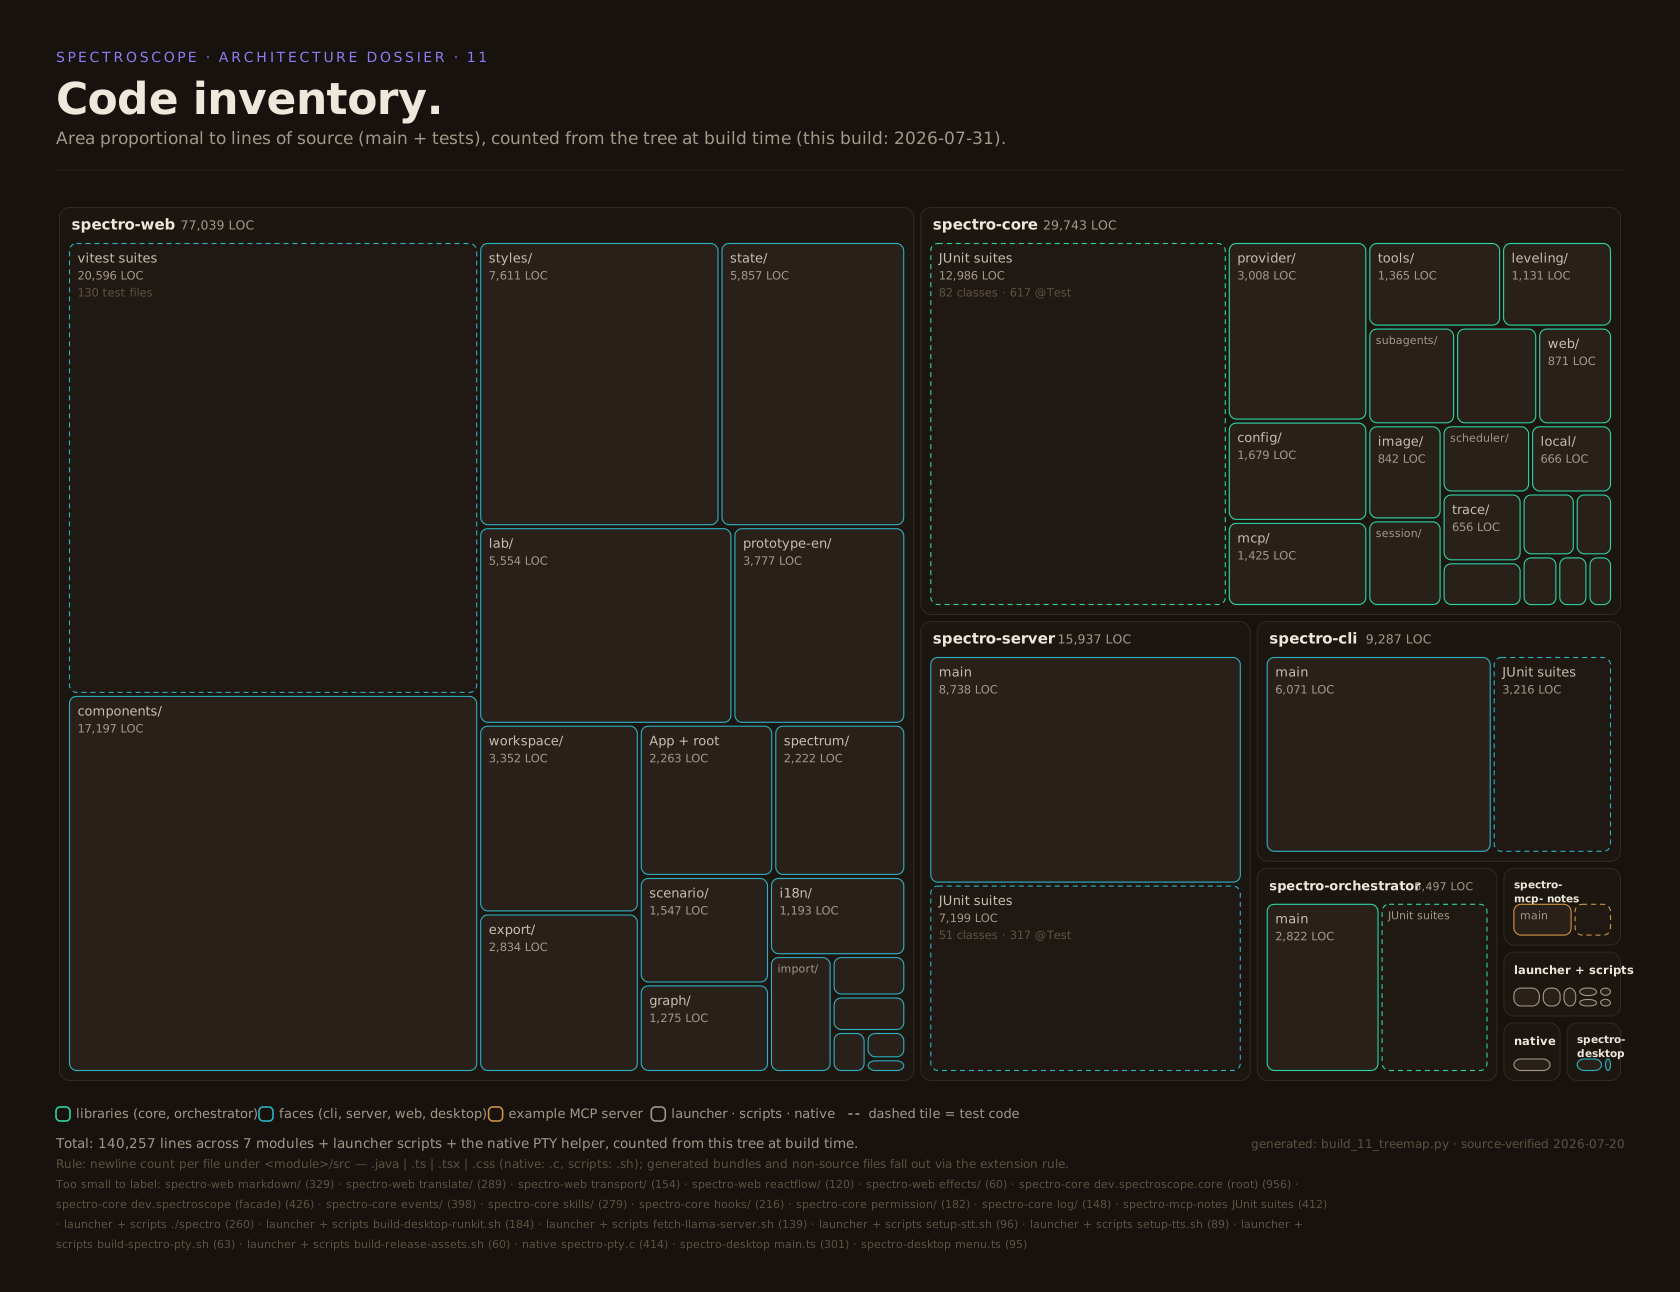
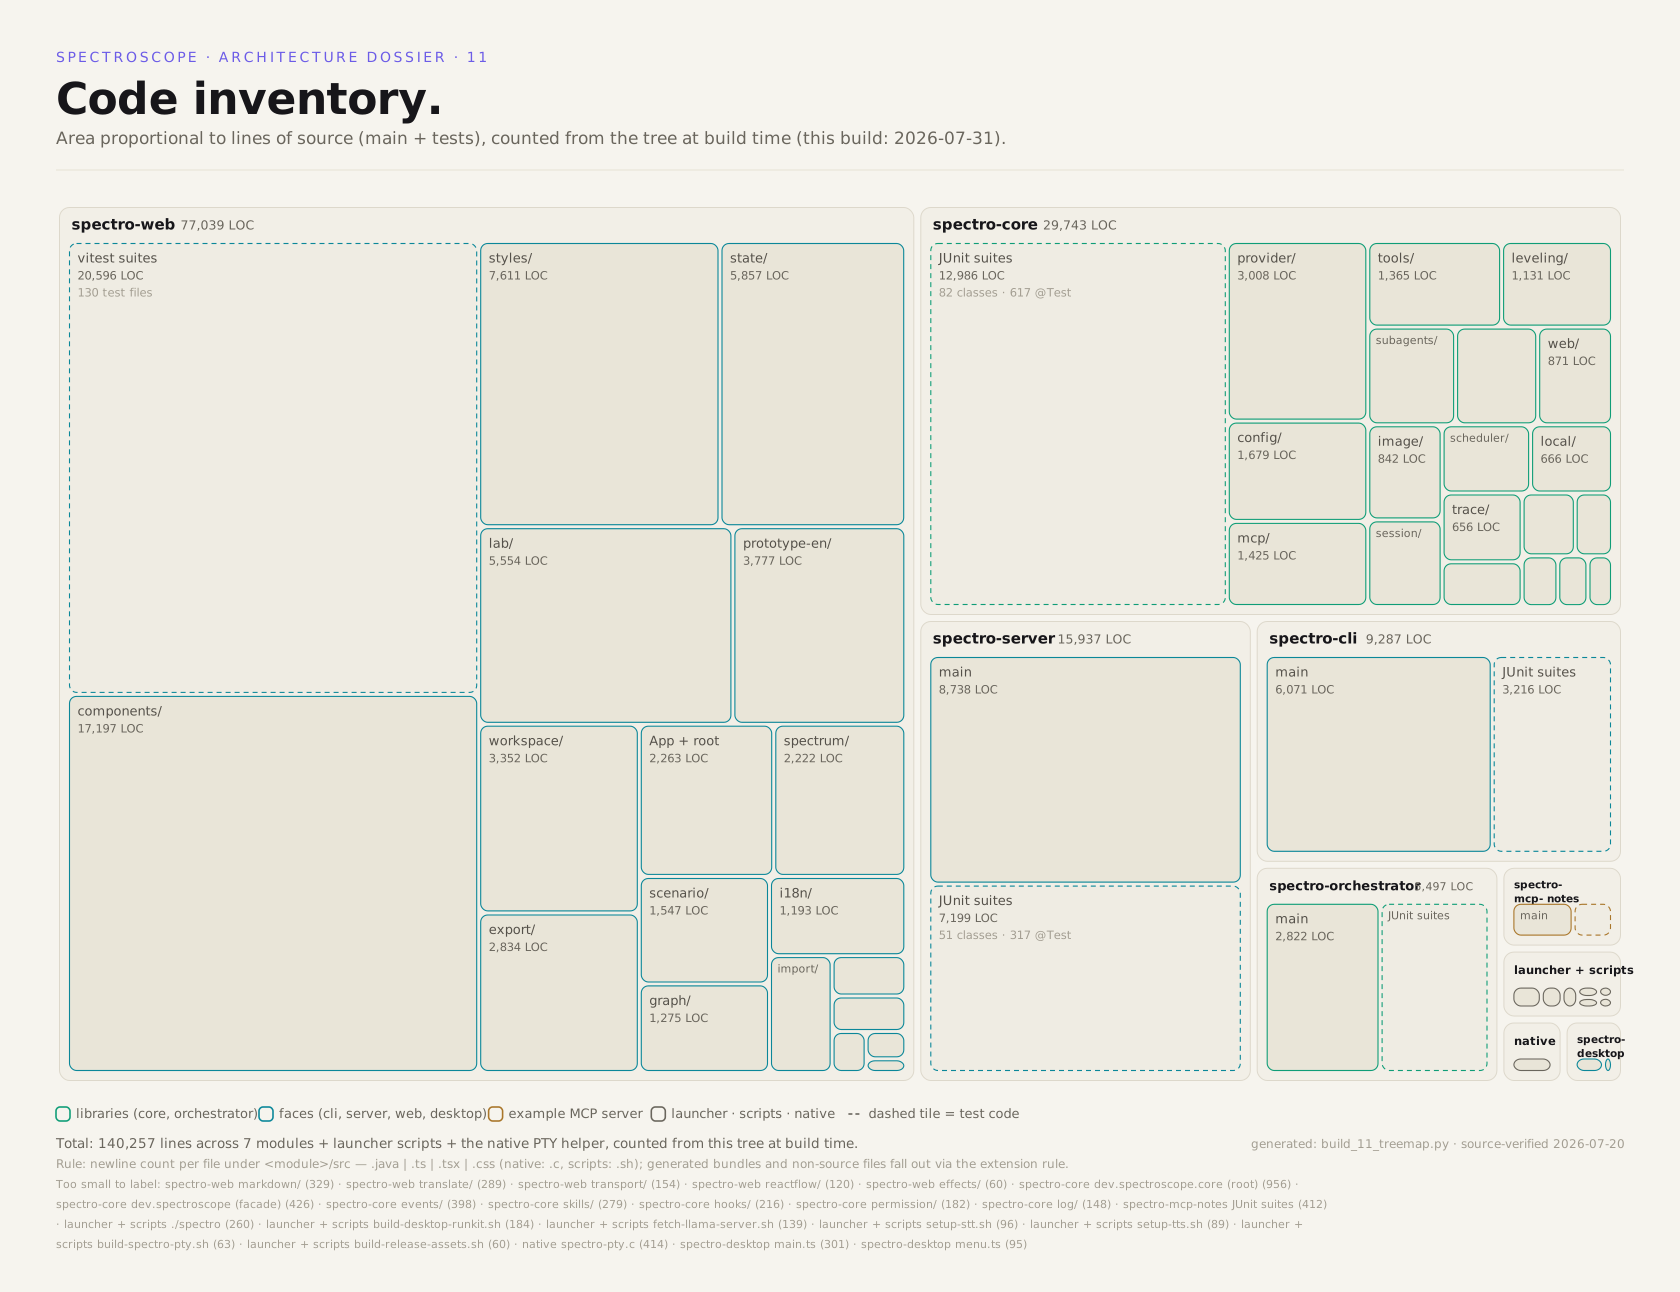
The codebase itself